
© 2025, Farok J. Contractor, Distinguished Professor, Rutgers Business School
This article is scheduled for publication in the Spring 2025 edition of the Rutgers Business Review.
Abstract
In the present debates about US manufacturing and trade deficits, the case of the Apple iPhone provides several useful insights. Looking only at the US-China trade balance, the iPhone alone – just one product – appears to create a sobering trade deficit of some $33 billion. However, this is misleading and can cause incorrect policy decisions because relatively little of the value of the iPhone is added in China, with the bulk of its value added in the US. Apple is responsible for far more jobs in the US (80,000 direct employees such as researchers, designers, managers, and marketers; plus an additional 450,000 jobs in the distribution of Apple products; and an estimated additional 1.5 million independent media developers and brokers) than abroad.

Understanding International Trade and Globalization
Many misrepresentations about international trade and globalization have circulated for years, and “trade wars” have been launched on the basis of misunderstandings of the nature of international business patterns. In the minds of the public glued to social media, Apple Inc. has occasionally been accused of being a major contributor to the trade deficit “suffered” by the US “against” China. The final assembly and shipment of iPhones occurs in China. This is true. But from a “value added” calculation, the iPhone is an overwhelmingly American product, and China contributes little to its content. The objective of this post is to show how a focus on only selected trade data and tariffs obscures the larger picture and contributions by companies.
The iPhone is also an excellent illustration of the nature of global supply chains with components sourced from as many as 13 to 15 nations, each specializing in a particular component – according to its comparative advantage theory.[1] The basis of international supply chains and offshoring is a disaggregation of a product’s value chain (e.g., from R&D to production to marketing to after-sales services) and a dispersal of various pieces of the value chain over different nations according to each country’s comparative advantage. This specialization (by component or service) in each country puts a technological marvel in the hands of customers at a reasonable price. If all components and assembly of, say, the iPhone 16 were sourced domestically in the US, the final estimated price would likely rise from the current average of $1,100 to $3,500.[2] So, are Americans “suffering” from a trade deficit, or, as consumers, are they “enjoying” the benefits?
This case raises several other questions: Is an iPhone a product or a service? Like many American companies, Apple Inc. has been accused of “de-industrializing” the US economy. But Peneder & Streicher identify another aspect.[3] Increasingly, what we call “manufacturing” has “embedded (in the product) intermediate services” (parentheses added) that may often constitute the majority of a so-called product’s value. The cost of the raw material content in an iPhone may be less than $6. The global transportation cost and labor content for each iPhone (components and finished product) may comprise another $150 at most. Yet the phone sells for some $1,100. The bulk of an iPhone’s value, therefore, is not in matter but in thought – in intangibles and intermediate services such as R&D, design, supply chain orchestration, management, marketing, and some profits to shareholders in Apple Inc. and its supplier companies – most of which occurs in the US. As Peneder & Streicher put it, “…advanced economies use services more intensively as intermediate inputs (also for the production of other services). …” Hence, looking only at import/export data (especially on a bilateral basis, for example US-China) can be very misleading.
Deconstructing the iPhone’s Component Sources
Apple Inc. is understandably wary of bad publicity and keeps the details of its worldwide procurement a proprietary secret. However, various analysts (e.g., Jie & Winkler in a Wall Street Journal piece[4]) have been able to surface information about the iPhone 16’s components and costing.
The figure shows major suppliers in only five nations: Taiwan, South Korea, China, the US, and Japan. But these suppliers of major components for the iPhone 16 in turn likely source subcomponents and materials from yet eight or ten other countries. (Depending on the degree of disaggregation of the international value chain, Ross estimates that there could be as many as 43 source countries contributing some value to an iPhone.[5])
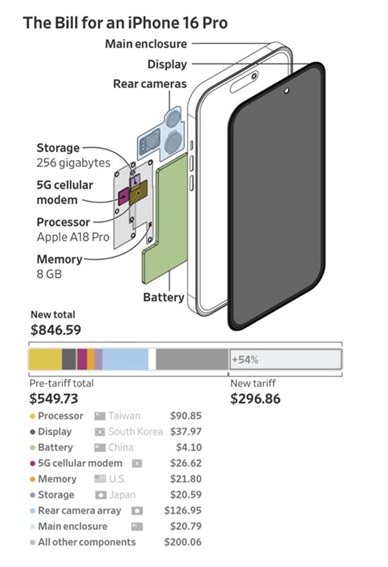
Source: Jie & Winkler, Wall Street Journal, April 8, 2025
These raw materials, components, and subassemblies eventually flow to assembly plants in China operated by Apple’s partner there, Foxconn, where the components are assembled into a finished iPhone, packaged, and shipped to the US and other nations. An estimated $14 for each iPhone is paid by Apple to Foxconn for the final assembly.
As of 2025, Apple is also beginning to assemble the iPhone 16 in India (using Foxconn as a partner there as well) and Brazil. But the analysis below focuses only on China-US trade as an illustration.
For purposes of the calculations below, let us ignore the US tariff, which is simply an additional US tax collected by the US Customs – a figure that anyway does not affect the actual value added in China or the value added in the US. Moreover, it is unknown at the time of this writing.
From the numbers in Figure 1, we see that the total cost of the components to be assembled in the Chinese factories comes to $549.73. Add to that the estimated $14 Apple pays Foxconn in China for assembly, and the total cost of a finished, assembled iPhone 16 comes to: $549.73 + 14.00 = $563.73. The Chinese portion is only $4.10 + 20.79 + 14.00 = $38.89, as seen in Figure 1.
Looking Only at Trade Statistics Can Frighten and Mislead
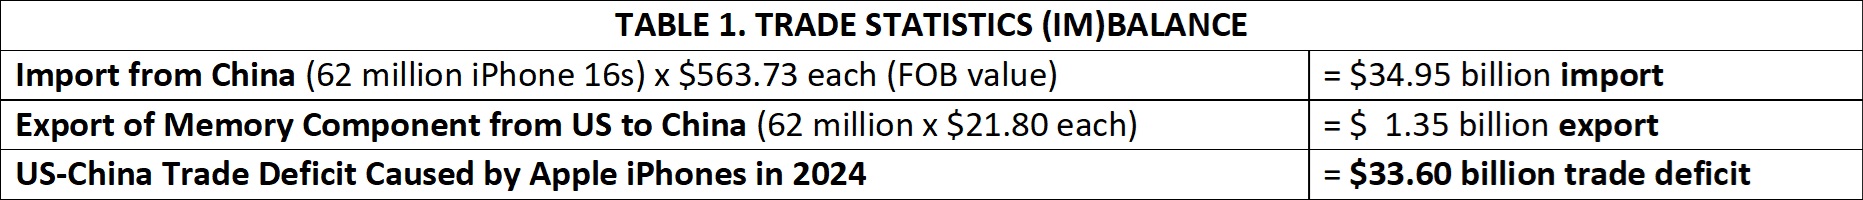
Trade data alone mislead for several reasons. First, most of the component trade flowing from other nations to China is not counted in the bilateral US-China trade statistics. When an iPhone is assembled and shipped to the US, its approximate $563.73 free on board (FOB) invoice value is counted in the trade data[6] as the value of the “iPhone imported from China.” The bilateral US-China trade data count only the (a) $563.73 invoiced amount of the finished, assembled iPhone 16 (shipped eastward by Foxconn from China to the US) versus (b) $21.80 worth of US-made components (shipped westward from the US to China for assembly there).
According to Liang & Chen’s estimate,[7] 62 million finished iPhones were imported from China into the US in 2024. Taking that as a measure, and for discussion purposes using the iPhone 16 cost numbers, we get the trade (im)balance shown in Table 1.
Click table to enlarge
Looking at trade data alone presents a frightening picture. Just one company appears to contribute so much – $33.6 billion – to the US trade deficit. A few trolls unfairly lambasted Apple on social media platforms. But the trade statistics are far from the whole picture.
A Value-Added Comparison Shows a Very Different Picture
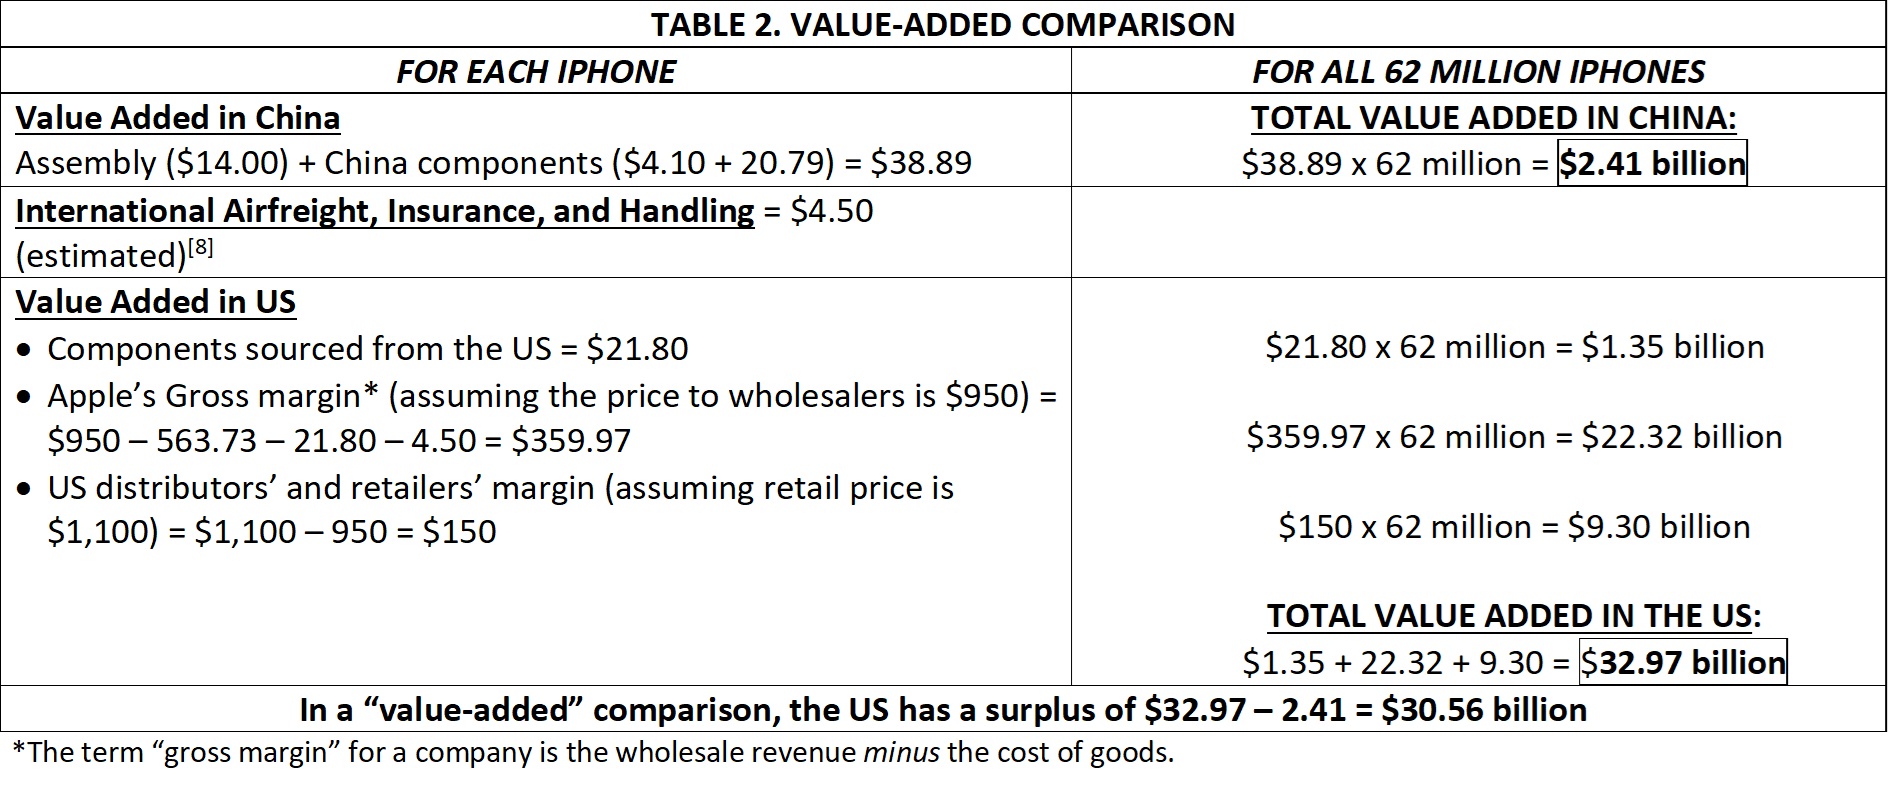
To get a more balanced and complete assessment, as shown in Table 2, we have to ask: What value is being added in China? and What value is being added in the US?
The estimates in Table 2 show that the value being added in China is only $2.41 billion annually (for the battery, case, and assembly of each phone).[8] The value added in the US is for the US-sourced components ($1.35 billion), plus the gross margin of Apple Inc. ($22.32 billion) and its distributors and retailers ($9.30 billion), totaling $32.97 billion.
Click table to enlarge
What is Apple’s “gross margin” per unit? It is the $359.97 difference between its wholesale revenue for each phone minus the cost of importing each item. (Tariffs are only an additional tax – not value added – and tariffs are neglected for purposes of this article, which is a value-added comparison.)
Is this gross margin of $359.97 the profit per iPhone? No. The gross margin totaling $22.32 billion is used to pay for Apple’s 80,000 American employees – brilliant R&D scientists, technicians, designers, IT specialists, managers, marketers, supply chain personnel, etc. – who are talented enough to earn a median $127,000 salary annually.[9] Only after paying for its US employees, US domestic transportation, distribution costs, marketing, and other overheads can what is left over be called “profit.” True, the great majority of Apple’s value added in the US is in high-end, valuable services – such as research, design, clever management, and orchestration of international supply chains and marketing – and not manufacturing or production, which is done abroad. Hence the earlier rhetorical question: Is the iPhone a product or a service?
Alternatively, we can ask: How much of what economists classify as “manufacturing” actually contains intermediate services? This relates to an even broader debate about the role of manufacturing in the US economy and the nostalgic misperceptions that surround that question.[10]
Like most firms, Apple Inc. maintains confidentiality about its procurement countries and costs. Hence, the above numbers are the best estimates made by journalists and others in the industry. Some of the estimates diverge, and, moreover, not all phones sold are iPhone 16s. But the general conclusion about how much value is being added in China versus how much in the US remains valid.
How Do We More Accurately Assess the Role of International Trade and Globalization in the US Economy?
Bilateral trade statistics (especially those between the US and China) can mislead politicians and the public into believing that the US’ participation in international trade is somehow dangerous. Looking only at trade data for Apple Inc., we see above a seemingly scary deficit of $33.6 billion created by just one company’s single product (see Table 1). Many are misled into thinking that such deficits are detrimental to manufacturing and jobs in the US.
Globalization and offshoring do not always mean loss of US jobs. At least in the Apple example, the majority of jobs are in the US. Apple states that it directly employs 80,000 talented persons in the 50 US states, with a median salary of $127,000.[11] In addition, Apple states that its US independent suppliers and retail distributors employ 450,000 more. Moreover, its website claims that the Apple App Store “ecosystem” gives employment to 1,530,000 more persons. Outside the US, another 84,000 are claimed to work for Apple’s foreign suppliers and distributors.
Most of Apple’s US jobs do not involve screwdrivers or production tools. Rather, they involve thought, skills, learning, and training. In short, Apple, like many firms in the US, provides high-end services: 77 percent of the US GDP is in services and only 11 percent is in manufacturing. However, that 11 percent amounts – in dollar terms – to the second largest manufacturing output among all countries, which is nothing to lament in stump speeches, but rather something to be proud of. When it comes to US manufacturing, there is a lot of unwarranted misinformation. US manufacturing output is not only huge – the second biggest in the world – but American workers are also nearly the most productive on earth.[12]
This is the nature of modern, advanced economies, with the majority of work performed in services and a minority in manufacturing. A “service economy” is driven by creativity and innovation. The real strength of US companies is in their R&D, which is a long-term job creator.[13] Some companies, like Apple, illustrate the best type of bargain: orchestrate foreigners to do the work of producing products abroad at lower wages while retaining high-value service jobs, as well as high-end automation and robotics-enabled manufacturing jobs, at home.
APPENDIX
The Irrationality of Collecting Tariffs on the Finished Value of a Product
Many governments assess tariffs (paid by the importer and eventual customers in the nation) on the finished value of the import. In the automobile sector, an auto component made in India could be shipped to Mexico and integrated into a subassembly there, and then the subassembly could be shipped to Canada for final assembly of the finished vehicle, which is then sent for sale in the US car market. This is the nature of international supply chains. If tariffs are applied at every country border on the (thus-far) finished value of the intermediate product, then the India-sourced auto component could incur three tariffs on its journey to the eventual US consumer.
We can see in the Apple example how the value added in China amounts to only $38.89 in an iPhone 16. But the US customs department may assess a punitive tariff on the entire $563.73 FOB import value of the phone because all the components were finally assembled in China and shipped to the US from there.
Some governments rebate or refund part of the tariff paid if the company can show what portion or component of the imported item’s value was initially sourced from other countries. But in the context of complicated international supply chains, that can become an accounting difficulty, if not an accounting nightmare for both the company and the customs authorities.
Endnotes
[1] Ricci, L. A. (1999). Economic geography and comparative advantage: Agglomeration versus specialization. European Economic Review, 43(2), 357-377.
[2] Leswing, K. (2025). Here’s how much a ‘Made in the USA’ iPhone would cost, citing a calculation by analyst Dan Ives at Warburg Securities.
[3] Peneder, M., & Streicher, G. (2018). De-industrialization and comparative advantage in the global value chain. Economic Systems Research, 30(1), 85-104.
[4] Jie, Y. & Winkler, R. (2025). Apple to Source More Phones from India. Wall Street Journal. April 8, 2025. This article shows calculations from TechInsights, iFixit, and FactSet. Published online April 7, 2025, as Apple Plans to Source More iPhones From India as Potential Tariff Fix.
[5] Ross, L. (2020). Inside the iPhone: How Apple Sources from 43 Countries Nearly Seamlessly. Thomasnet. July 21.
[6] US trade statistics typically count the FOB or “free on board” invoiced amount as the import value. Customs Value | U.S. Customs and Border Protection.
[7] Liang, A. & Chen, C. (2025). China-made iPhones exempt from tariffs, US Commerce Secretary hints at future taxes. DigiTimesAsia, April 14, 2025.
[8] Airfreight estimated at an average of $6 per kilogram. Each iPhone 16 weighs 170 grams, or an estimated 250 grams including packaging and crating – 4 iPhones per kilogram. Hence, the airfreight cost per iPhone is 6/4 = $ 1.50 each. Add an estimated $3.00 for insurance and port handling, and the total international transport cost = $4.50 per iPhone 16. Reasonable estimates are used because Apple Inc. considers this to be proprietary information and will not divulge details.
[9] Macrotrends (2025). Apple: Number of Employees 2010-2024 | AAPL | MacroTrends.
[10] World Economic Forum (2025). 5 misconceptions about manufacturing that belong in the past. May 13, 2025.
[11] Apple.com (2025). Two million U.S. jobs and counting.
[12] As measured by the ratio of “output value” divided by “number of workers.” One main reason US manufacturing workers are so productive is that their manual labor is aided by automation and robots. Incidentally, automation is a big factor in the reduction in US manufacturing jobs (despite continued growth in the value of output). Automation may have “destroyed” as many jobs in manufacturing as are blamed on “offshoring” or globalization.
[13] Economic history (not just theory) shows that the international competitiveness of an industry declines when there are tariffs or other import protection measures introduced by a country’s government. Enjoying import protection, or insulated from international competition, domestic firms become complacent and have reduced incentives to invest in R&D and innovation, so that the protected industry falls behind foreign rivals in technology, design, and price-based competitiveness.
