© 2017 Farok J. Contractor, Rutgers Business School
 The rise of nationalistic political leaders has spanned the globe—from Donald Trump and Marine Le Pen in the West, to Recep Tayyip Erdoğan in the Middle East, to Narendra Modi and Rodrigo Duterte in the East. To varying degrees, each of these leaders espouses an “our country first” mentality, skepticism or outright hostility toward multilateral institutions and global trade, and leadership styles that emphasize ethnic or group identification, distrust of immigrants, and increased assertiveness—sometimes bordering on bluster and aggression.
How do we measure this phenomenon called globalization? What are some of the underlying causes of the antiglobalization backlash? Is national progress incompatible with global progress? Has globalization stopped or slowed in recent years? I will address these questions in Part I, below, of this two-part series. In Part 2: Global Leadership in an Era of Growing Nationalism, Protectionism, and Antiglobalization, I ask what kind of leadership qualities are needed to build a global civilization.
![]()
Globalization and How to Measure It
To trace the progress and slowdown of globalization, we first need to measure it. Various criteria of globalization have been used by the Organization of Economic Cooperation and Development (OECD),[1] consultants such as McKinsey & Co., and academics.
These criteria generally include:
• Trade flows (products and services)
• Investment flows (portfolio and direct investment capital)
• Information flows (cross-border information and data flows on internet networks)
• People flows (persons crossing borders temporarily or permanently)
One of the most comprehensive globalization indexes was developed by Pankaj Ghemawat at New York University and sponsored by DHL (a global courier and delivery service). The categories are shown in Exhibit 1. The weightings of the sub-indexes roughly correspond to their relative importance in the world economy. The DHL “Depth” measure is a ratio of a country’s international flows compared with its domestic economy (GDP), whereas the “Breadth” index compares a country’s distribution, or spread, of international flows with the rest of the world’s distribution of the same index.
Exhibit 1: DHL Global Connectedness Index 2016[2]
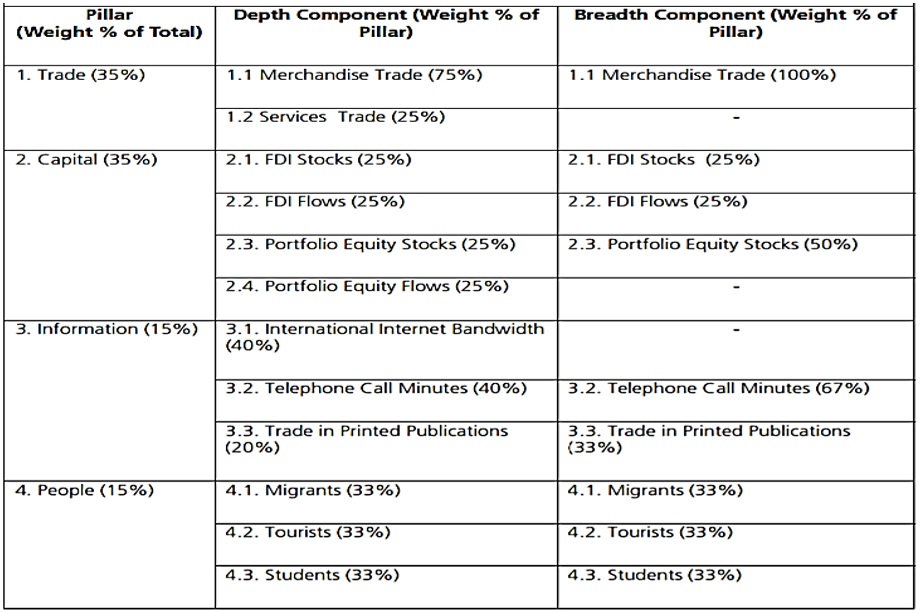
Source: Ghemawat, P., and Altman, S.A. (2016). DHL Global Connectedness Index 2016: The State of Globalization in an Age of Ambiguity.[2]
How has globalization progressed (or some say shrunk) in the past decade? Exhibit 2 shows the movement of the Depth, Overall or Average, and Breadth indexes over the period 2005–2015. For a half century after the end of World War II, by most measures globalization had shown an unremitting upward increase. But some things began to go wrong around the year 2005. The great recession of 2008 is reflected in the dip in the graphs. And indeed, on the “Breadth” measure, globalization has been flat or has even shrunken slightly since 2005. The Breadth measure tracks the geographical spread of multinational activity. The Depth measure, by contrast, tracks the penetration of international trade, investment, data flows, and people in each country—i.e., how deep a role globalization is playing in each nation’s Gross Domestic Product (GDP).
Exhibit 2: How Globalization Has Progressed or Shrunk Recently
(2005–2015)[3]
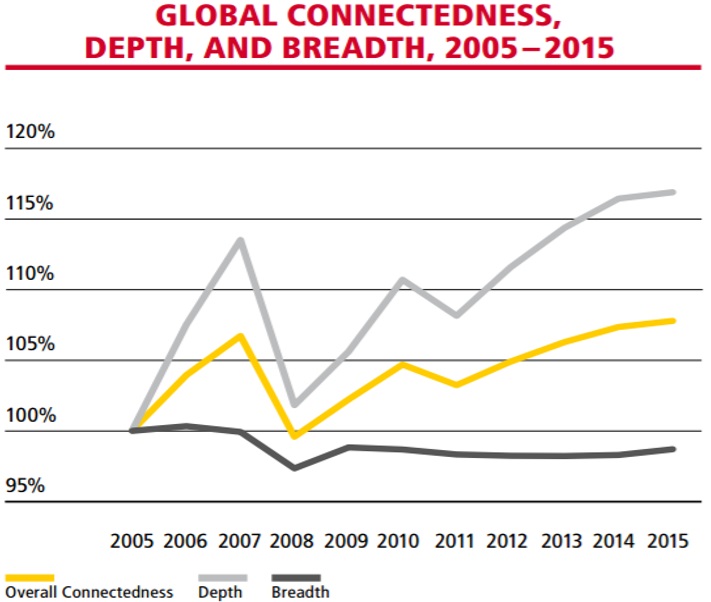
Source: Ghemawat, P., and Altman, S.A. (2016). DHL Global Connectedness Index 2016: The State of Globalization in an Age of Ambiguity.[2]
By the Breadth measure (coverage of number of countries), globalization may indeed have plateaued temporarily.3 But by Professor Ghemawat’s Depth and Overall indexes, globalization kept increasing at a healthy rate after the dip in 2008, as seen in Exhibit 2.
Taking a longer sweep of history over the last two centuries gives us an even more dramatic perspective on how world civilization has integrated across borders. See Exhibit 3. While international trade over distances of thousands of kilometers has been occurring since the Babylonian and Persian empires 2,600 years ago, a big acceleration in globalization has occurred from the year 1800 onward. The overall trend, covering two centuries, is decidedly upward, although we see in Exhibit 3 that exports and Foreign Direct Investment (FDI)[4] as a percentage of GDP declined temporarily after the Great Depression, with exports recovering and growing exponentially after 1950. FDI took off sharply after the 1980s following the collapse of socialist ideologies, as well as a liberalizing sea-change in government attitudes that began to welcome multinational companies into local markets.[5] Today, for the most part, governments appear to be falling over each other to welcome FDI.
Exhibit 3: Globalization Over the Last 215 Years[6]
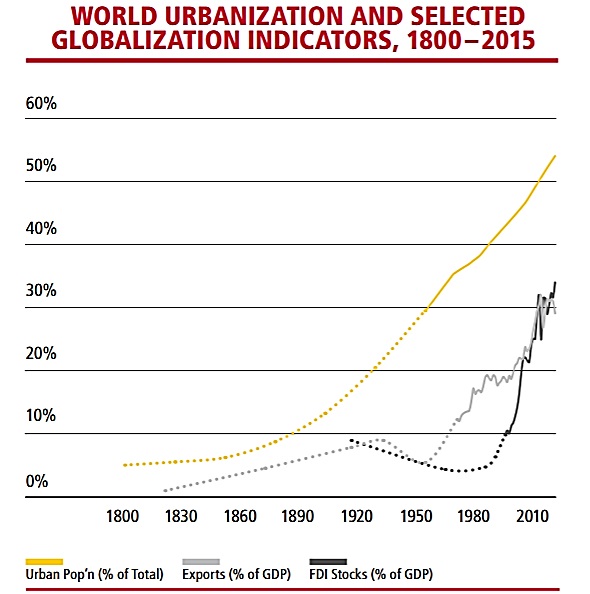
Sources: Ghemawat, P., and Altman, S.A. (2016). DHL Global Connectedness Index 2016: The State of Globalization in an Age of Ambiguity,[2] who in turn drew from UNCTAD, World Bank, and IMF data.
Agglomerations and Networks: Their Impact on Civilization and Global Business
An even more significant change affecting world civilization generally is the acceleration in the exchange of ideas and innovation through physical proximity. Historically, humans had been isolated into small groups of hunter-gatherers. Even after the agricultural revolution around 10,000 BCE, relatively little interaction occurred between isolated farming villages and communities. Urban centers such as Babylon, Rome, ChangAn (Xian today), or Pataliputra (Patna today) were the exception, never containing even at their peak more than a few hundred thousand inhabitants each—so 95 percent of humanity lived their entire lives within a 10 kilometer radius. See the urbanization graph in Exhibit 3.
Innovation, science, and progress require a cross-fertilization of ideas, to say nothing about mass production needing a market of sufficient national or international scale that can sustain the development and sale of new products and ideas. By the year 1800, barely 5 percent of humanity lived in urban centers. Today, 55 percent of us do so, as seen in Exhibit 3. Urban clusters, such as Silicon Valley and Bangalore, where like-minded firms and individuals congregate, confirm the need for physical proximity of technicians to spark the interchange of knowledge and ideas.[7]
But it is not just high-technology sectors such as Information and Communication Technology (ICT) and Bio-Pharmaceuticals that form clusters. Mundane production industries do the same: 70 percent of bags and suitcases sold in the US and Europe are produced in Shiling, China (population 350,000); 90 percent of global-brand eyewear comes from Ouhai, China (population 900,000); and 85 percent of polished diamonds destined for the global market are produced in Surat, India by over half a million workers.[8]
And this is not just about cheap labor. An agglomeration of local suppliers of, say, only zippers, or diamond-polishing compounds, or plastic injection-molding machinery provide accumulated expertise and rapid delivery because of proximity to the assemblers of the final product. Buyers from abroad communicate quality and design standards that spread throughout firms in the cluster. Physical proximity rapidly disseminates ideas, designs, labor, standards, and materials for rapid response to changes in global market demand.
But why do we need physical proximity in an internet-connected world? Virtual networks do substitute for physical proximity[9]–partially. In the new millennium, ICT networks are as critical a measure of globalization as are shipping lanes for the export of goods. The globalization measures in the DHL Global Connectedness Index[2] shown in Exhibit 4 indicate this as the fastest growing component of its index. Whereas International Trade, Cross-Border Capital, and Migration of People increased by barely 10 percent in the 2005–2015 decade, Information Flows zoomed by more than 60 percent.
Exhibit 4: Globalization Measures in the DHL Globalization Index[2]
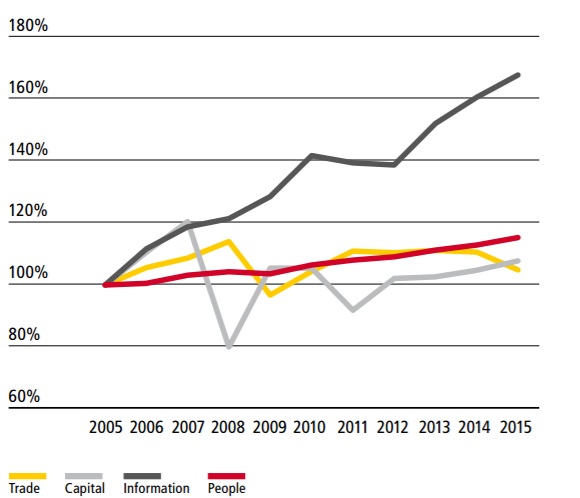
Source: Ghemawat, P., and Altman, S.A. (2016). DHL Global Connectedness Index 2016: The State of Globalization in an Age of Ambiguity.[2]
The Viral Spread of Thoughts, Sentiments, and Phobias Worldwide
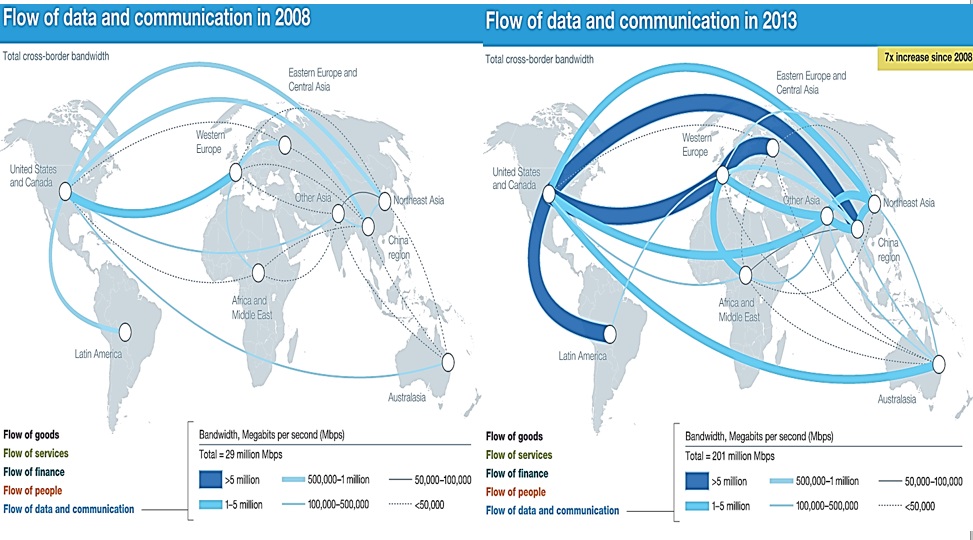
If we define globalization not merely in commercial terms (exports, capital, etc.) but also in terms of the transmission and blending of ideas, concepts, lifestyles, cultures—and also phobias—then the introduction of the internet must surely be reckoned as a major inflection point in human history. Exhibit 5 from the McKinsey Global Institute[10] illustrates the huge change in just five years’ time. All bimodal connections have grown tremendously. But notably, the transatlantic connection, which used to be the largest, is now rivaled by China’s connection with the US and the emerging US link with Latin America. In 2017, 3.5 billion humans access the internet. Bandwidth, which was less than 4.5 terabits per second in 2005, has escalated to 400 terabits per second in 2016.[11]
Exhibit 5: The Growth of Bandwidth and Megabits Per Second[10]
The term “virus” is not inappropriate. In my opinion, humankind is developing an emerging “global consciousness”—a global simultaneity and collective sensitivity to noble thoughts, as well as to phobias and ignoble protectionism. The same channels that transmit the latest décolleté fashion styles from Milan or Gangnam music style from Seoul to a farm family outside Bombay or Basra also then engender in those consumers a feeling of cultural unease or ambiguity, raising questions about identity that are often expressed in a backlash against globalization.
The Backlash Against Globalization
Antiglobalization sentiment springs from very different sources in the developed and the developing worlds. In richer nations, globalization has been (for the most part falsely) accused of causing job losses and economic stagnation. In developing nations, the reaction stems from the threats to identity because of the influx of foreign products and ideas.
Cultural Angst
Among the more than 10,000 Catholic Christian saints, St. Valentine (226–278 CE) of Terni, Italy remained a relatively obscure figure until the 1850s, when American entrepreneurs began marketing greeting cards. Even past the middle of the 20th century, Valentine’s Day was  unknown outside the US and the UK. Today we have the astonishing spectacle every February 14 of malls in Asian cities from Beijing to Singapore thronged with extra shoppers and restaurants and shows being heavily booked, with streets suffering additional traffic because of this almost mythical figure who lived 1,700 years ago and 8,000 kilometers away.
The transmission of ideas, fashions, and “cultural” practices began before 1998 via print media. But the internet has radically speeded up the interchange. One may ask, “What’s wrong if flower and chocolate shops in Asia and Latin America do additional business on February 14?” After all, if consumers and merchants are happier, that may appear to be a good thing.
But not everybody agrees. Demonstrations against Valentine’s Day occur almost annually in India, some involving vandalism of shops, and also resulting, albeit rarely, in the lynching or suicide of harassed couples.[12] Hindu fundamentalist groups protest the incursion of foreign cultural practices as eroding traditional culture. Exhibit 6 shows an example. The photograph contains unintended ironies, however. First, no women are among the demonstrators. Second, the protest signs are in English, the language of globalization. Third, none of the men are wearing traditional Indian clothing, but instead have donned western shirts and trousers (a style that has taken over among Indian men).
Exhibit 6: Demonstration Against Valentine’s Day

The incursion of foreign styles and culture is threatening to all ancient societies. Only one or two generations ago, the markers of identity in India or Korea or Bolivia or the Middle East were based on local religion, traditions, and small-distance familial relationships.[13] Today, to their children squinting at a small screen, “all the world’s a stage.”
Job Losses
The laid-off workers in the rust belts of Ohio in the US or Northeast France bear a different grudge. Whipped up by politicians such as Donald Trump and Marine Le Pen, they blame globalization for their misfortunes. The job losses and angst are real. The diagnoses of politicians (blaming trade and immigration) are grossly overstated or false. Exhibit 7 shows the results of an analysis done by the McKinsey Global Institute, which concludes that in six industrialized nations (with the exception of Sweden) the majority of households saw a flattening or drop in their wages and investment income.[14] Even after accounting for taxes and transfer payments, households in Italy, the Netherlands, and the UK were affected. Undoubtedly, a major reason was that the year 2014 was compared with the year 2005, a period during which the effects of the Great Recession were still present in most nations.
Exhibit 7: Flat or Falling Incomes[14]
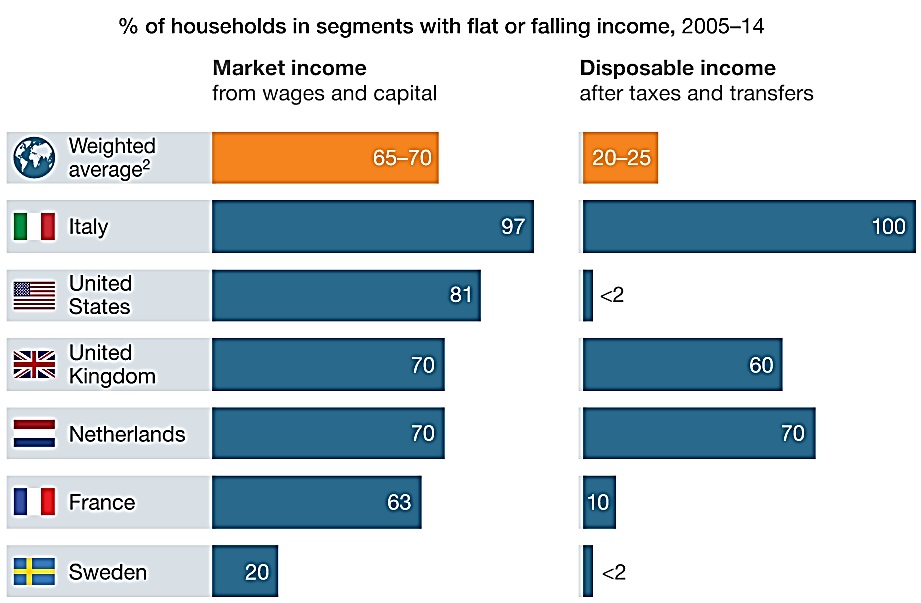
Note that it is easy to misread the survey results in Exhibit 7. The survey covers both “falling [as well as] flat incomes.” But for many respondents, even if their income remained “flat” for a decade, that is certainly cause for dismay—a legitimate concern that politicians such as Le Pen and Trump latched onto and magnified.
In 2017, jobs have rebounded since 2014. However, a sense of malaise lingers. Employees in the US and Europe (and perhaps worldwide) are working harder, running faster, and more apprehensive because of greater competition in the labor market, aided by the relentless drive for productivity gains through automation and ICT. Most depressingly, the McKinsey report suggests that a great psychological letdown is felt in western nations, where two centuries of economic progress led every generation to believe they would be better off than their parents. No longer.[14]
Politicians demagogically put the blame on international trade, the offshoring of production, and immigrants allegedly robbing native-born citizens of their jobs. This assertion is true only in small part. For every one US job lost through international trade (1980–2016), informed analysts, such as the Wharton School,[15] conclude that three or four jobs have been lost because of automation, robotics, information technology, and other productivity boosters.
The simplest example of a “productivity” measure is “output-per-worker.” When workers are laid off and replaced with machines, computers, or robots, the same output comes out of a factory, but with fewer workers. This raises the output-per-worker ratio, or productivity measure. Automation, much more than international trade, has made the US the world’s most productive nation, by far.[16] International business has certainly produced cheaper prices for industrial and retail consumers. But productivity increases and automation have delivered far greater benefits.
Which groups have benefited the most from the productivity gains in the US and Europe over the last 30 years? There are three principal beneficiaries (and they do not include labor):
• Consumers of the finished products and services, who benefit from cheaper prices when productivity savings are passed on to buyers.[17]
• Top managers of companies that award themselves bonuses and higher salaries in cases where the incremental profits from productivity gains need not be passed on to consumers in the shape of lower prices, but can be otherwise allocated. (It is worth noting here that the power of unions in Europe, and particularly in the US, has greatly diminished, so they cannot demand a significant share of the incremental benefits for workers as in the past. Union membership in the US, for example, has fallen to a low of less than 10 percent of the workforce.)
• Shareholders of the firms who expect, and get, fatter dividend distributions and equity growth.
What about labor sharing in the benefits? Gains from automation, robotics, ICT, and artificial intelligence have not gone to labor, as many studies show.[18] Over the past 15 years, the best an American or Western European worker could hope for, on average, is to keep his/her job and earn the same pay as before. Workers laid off because of automation degrade to lower-paying jobs and/or receive government assistance, which partially ameliorates their pain (this is why the right-hand side of Exhibit 7 shows lower percentages compared with the left-hand side).
International trade (on the import side only) and globalization have undoubtedly resulted in job losses. But automation has caused far more. The benefits of cheaper imports are widely dispersed to all the consumers in an importing nation. (In a hypothetical scenario, assuming all Chinese manufactured imports were replaced by US manufacturing, I calculated an additional cost of $295 billion to American consumers.[19] That is to say, the average US household benefits to the tune of $2,380 each year because of Chinese imports compared with the make-it-in-America alternative.)
On the export side, international trade creates millions of new jobs. But the pain of import-induced job losses tends to be geographically concentrated in certain regions of France and the US.[20] Depending on the voting system, these (dis)affected regions can sometimes have a disproportionate impact in elections in some countries.[21]
Immigration
Most studies (even those by authors with a conservative bent)[22] concur that immigrants, on the whole, produce a net benefit for a country in the medium and long run. That is to say, on average, and over time, immigration produces a net benefit for the host nation. Alas, the economists’ and sociologists’ favorite expressions, “on average” and “over time,” are small comfort to those affected in labor markets by competition from immigrants—generally at the unskilled or low-income end of the spectrum. As in the case of import competition, the pain of job competition is concentrated in a small proportion of the population, while the benefits of immigration are widely spread over the entire population. (For example, while all Americans benefit, few think about how much more their lettuce, or meat, or lawn-cutting service, would cost were it not for Latin American and Mexican immigrants who toil in difficult conditions for a pittance.)
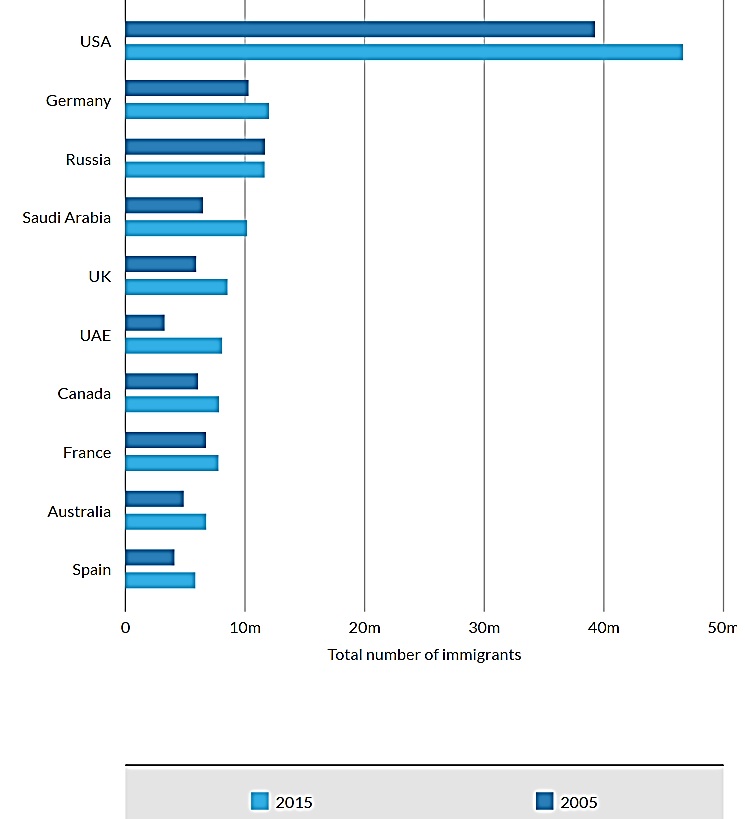
Exhibit 8 lists the 10 countries with the largest immigrant populations. With the exception of Russia, the number of immigrants has increased slightly since 2005. Nevertheless, for most on the top-10 list, immigrants constitute only around 11–14 percent of the population. (Exceptions are small-population nations with a large land surface: Canada, Australia, and Saudi Arabia, which have quietly been welcoming selected immigrants to boost their GDP and expand and spread their populace over their large empty spaces.)
Despite as many as 43 million US residents born elsewhere, immigrants (both legal and undocumented) constitute only around 13 percent of the overall US population of 326 million in 2017. Germany, France, and the UK have comparable or lower percentages.
Exhibit 8: Countries with the Largest Immigrant Populations, 2015 and 2005[23]
Besides competition for jobs, mostly at the lower-income end of the labor market,[24] immigrants bring foreign ideas, religions, and ethnicity that threatens the self-perception and identity of sensitive native-born segments of the population.
Again, as in many aspects of globalization, the impact is concentrated in certain parts of each nation. Immigrants tend to congregate in certain cities and areas. The irony in the US and French presidential elections, as well as in the Brexit vote, was that in areas with the largest immigrant concentrations (such as New York, San Francisco, London, and Paris), the native-born votes went to the liberal and globalist candidates. But in areas where immigrants are scarce, or unseen (such as Wyoming and West Virginia in the US, or Lincolnshire in the UK), the votes went to the nativist scaremongers.[25]
How to explain this seemingly paradoxical result? In part, the answer lies in the fact that major metropolitan areas tend to be more prosperous and contain more educated and higher-income residents than outlying areas. Immigrants also cluster in major metropolises. Eventually, the proximity of multicultural ideas and ethnicities renders immigrants unthreatening to the native-born urbanites. By contrast, in Lincolnshire or Wyoming, where few foreigners are seen, residents, who may not be as well-educated as their urban counterparts, tend to be more fearful watching images of terrorism on their televisions, making them easier targets for scaremonger politicians.
In cold-blooded insurance or actuarial terms, the likelihood of an American being killed by a foreign-born terrorist is vanishingly small.[26] Even including the 3,000 deaths on 9/11/2001, the lifetime odds are roughly comparable to tornado deaths, at one in sixty thousand.[27] Since 9/11, which is unlikely to occur again on that scale, fewer than five Americans have died annually at the hand of terrorists, domestic or foreign. By contrast, around 350 Americans die annually by falling out of beds, chairs, or other furniture. Traffic fatalities in 2016 killed 40,000 people, and injured 4.6 million more, on US roads.[28]
Fragmentation of the New Media Landscape and Erosion of Trust in Institutions
Fear sells products as well as political platforms. Advertisers, mass-market television news stations seeking higher ratings, and campaign managers all know that the two bookends of mortality—sex leading to conception and death—hook viewers and secure votes. Male candidates can be more fascinating when gossip links them with multiple women.[29] A strong personality that frequently threatens or scares is similarly attractive to many.
 The internet has fragmented and multiplied media sources. At the turn of the millennium, Americans got their information from what were then considered reliable and venerable sources such as ABC, CBS, NBC, and the New York Times, just as the British public trusted its institutions such as the BBC and the Times of London. Today, that trust in institutions has eroded to the point where Donald Trump and Nigel Farage (the UK Independence Party [UKIP] leader principally responsible for Brexit) can openly mock the traditional news outlets—and get thunderous applause at rallies. Readers and viewers do not know whom to trust anymore.
As a result, many turn to Facebook and Twitter as their principal sources of “information.” Especially pernicious and troubling has been the role of algorithms in the new media companies. Half of 18–49-year-old Americans get their “news” online in a biased fashion.[30] According to a Pew Research study,[31] “About two-thirds (63%) of Americans say family and friends are an important way they get news.” What nobody realizes is that algorithms at Google, Facebook, and Twitter deduce what users prefer and then steer viewers toward “like”-minded customized news sources that their family, friends, and social network also read.
Why do Google, Facebook, Twitter, and others do this? The answer is that a user is more likely to purchase from an advertiser when the content viewed is congruent with his/her preconceptions and predilections. Similarly, Fox News, MSNBC, and Breitbart endeavor to lure and retain “like-minded” viewers whose biases are confirmed and reinforced every time they visit the site. No organization wishes to drive viewers away by presenting them with dissonant or uncomfortable facts—hence, the selective algorithm-driven filter.
Such viewer screening and algorithms create and perpetuate inbred, selective, and self-reinforcing “filters” that segregate the public into “alternative realities”—separate camps or “silos” from which the world looks very different, depending on which silo one occupies. Is it any wonder that politics in the US, Europe, and even Turkey and India are becoming polarized into groups with markedly different views on the same phenomenon?
This institutional failure away from objective journalism that presents a wide range of facts—however uncomfortable—should not be blamed on the internet, which is merely a dumb medium. Rather, it is a manifestation of a phenomenon that has been gaining momentum over the past three decades—the drive for profits superseding the duty of a journalistic institution or company to serve the largest interest of the public. (Mind you, I am a professor at a business school who very much believes in the social value of fair competition. But I also recognize that sometimes corporate interests diverge from the “greater good.”)
Conclusion: Is Globalization in Retreat?

No. Some aspects of globalization, such as trade, slowed down in the 2005–2014 period. And increasing nationalism in some nations such as the US, UK, and Turkey may result in greater protectionism against the import of several categories of products. Immigration may level off or decline in certain countries.
But the welcome mat continues to be laid out for incoming FDI. Cross-border data and communication flows continue to grow rapidly. Moreover, the giant domestic markets of China and India are far from a saturation point for foreign products and ideas. Indians and Chinese (who total 2.6 billion in number and constitute 37 percent of humanity) are not xenophobic. They are more ready to adopt foreign ideas and modern 21st-century lifestyles[32] compared with sections of US and European societies currently undergoing self-examination and angst. The “middle class” citizens that buy processed or manufactured goods and services in China and India have been variously estimated to total between 800 million and 1,400 million. They eagerly buy mobile phones from Korea or the US, watch action-oriented American movies with subtitles,[33] and clothe themselves in denim and tailored western-cut garments (see Exhibit 6 above).
Do not blame globalization. It is a symptom, and not the cause, of the introspection convulsing some western societies groping for the right balance between work and leisure in lifestyle, as well as between the competing claims of consumerism, corporate interests, and social justice.
Is globalization in retreat? The answer is a reasonably strong “no,” especially if the view is from an emerging nation context, rather than the West. While America and parts of Europe are in a temporary bout of introspection, developing nations are optimistically forging ahead. While aging infrastructure (roads and bridges) in the US needs attention, Donald Trump calls for billions to be spent on a border wall. Meanwhile, thousands of kilometers of China’s “One Belt, One Road” construction project, designed to connect China with Europe and Southeast Asia by road and train, have already completed, as well as a string of ports built on the Pacific and Indian Oceans.[34] The Asian Infrastructure Investment Bank (AIIB), with 70 emerging countries as members (from Azerbaijan to Vietnam), has an already subscribed capital of $100 billion and is sponsoring projects in Asia and Africa.[35]
The second broad conclusion of this post is that globalization has been falsely accused. It is not globalization, per se, that causes job losses, culture shocks, and xenophobia among sections of the public in the US and Europe. Rather, it is modernization of lifestyles and industries that more fundamentally alters the patterns of work and life. Much more than imports or offshoring, it is automation that eliminates jobs in advanced nations. Increased domestic competition (more than import competition) drives companies to try to cut costs and the labor content of production.

In part, Marine Le Pen is correct. (Even though she was defeated in the French presidential election by Emmanuel Macron, she received as many as 10.7 million votes, suggesting that antiglobalization sentiment remains strong.[36]) In the US, Western Europe, and indeed worldwide, the last 25 years have proclaimed the gospel of hypercompetition, with an intense focus on company stock values and profits. The power of unions has shrunk. This has tilted the social balance in favor of capital investors, top management, and all consumers (who benefit from better and cheaper products) and against labor. “Nothing wrong with that,” many would say. Indeed, before the 1980s, unions in several manufacturing sectors were perhaps overly strong, resulting in inefficiencies, low productivity, and meager profits. For each society, it is a matter of finding the right balance—how to manage the allocation of benefits accruing to (1) labor, to (2) consumers, to (3) top management, or to (4) shareholders.
Do not blame globalization. It is a symptom, and not the cause, of the introspection convulsing some western societies groping for the right balance between work and leisure in lifestyle, as well as between the competing claims of consumerism, corporate interests, and social justice.
![]()
In Part 2: Global Leadership in an Era of Growing Nationalism, Protectionism, and Antiglobalization, I tackle the question of what leadership qualities are needed in the 21st-century global economy and provide some historical and cultural perspectives on globalization.

Endnotes
[1] The Organization of Economic Cooperation and Development (OECD) is a research and policy think tank organized and funded by 35 of the richest nations.
[2] Ghemawat, P., and Altman, S.A. (2016). DHL Global Connectedness Index 2016: The State of Globalization in an Age of Ambiguity.Deutsche Post DHL Group.
[3] Ibid. Multinational companies grow out of their home markets to serve neighboring nations. But most multinationals—even the giant ones—have controlled subsidiaries typically in no more than 40-odd nations. A firm’s geographical spread has natural limits. In a ranking of countries, below rank 40 the remaining 153 nations are not considered attractive enough markets for most multinationals based in rich nations to bother with directly, or invest in substantially. See: Contractor, F.J. (2007). The evolutionary or multi-stage theory of internationalization and its relationship to the regionalization of firms. In: Alan M. Rugman (ed.), Regional Aspects of Multinationality and Performance [Research in Global Strategic Management, Volume 13]. Emerald Group Publishing Limited, pp. 11–29. Hence, the geographical breadth of coverage for most multinational firms is decidedly limited —even if the penetration, or depth of investment, in the favored 40-odd markets keeps increasing over time.
[4] Foreign Direct Investment (FDI) is the globalization category describing a multinational parent firm’s ownership of affiliates and subsidiaries in foreign nations. A “foreign affiliate” of a multinational company is a case where the foreign firm owns at least 10 percent of the shares in the local company: 10–49 percent is a minority share, and 50–100 percent foreign ownership is considered to be majority control. In fact, most foreign affiliates of multinational companies are fully owned subsidiaries, with 100 percent of the shares controlled by the foreign firm. (In the 18th century, the Dutch and English East India Companies had full control of their overseas operations—not by legally formed subsidiaries, but by royal charter.)
[5] The United Nations has been tracking government policy changes since the 1980s, data that show an almost worldwide dismantling of barriers and restrictions on incoming FDI. Despite opinions voiced against multinational companies, most governments today have a welcome mat put out for them. See United Nations Conference on Trade and Development (UNCTAD): Investment Policy Monitor database.
[6] From Ghemawat and Altman (2016),[2] who in turn drew from UNCTAD, World Bank, and IMF data.
[7] See McCann, B.T., and Folta, T.B. (2008). Location matters: where we have been and where we might go in agglomeration research. Journal of Management, 34(3), 532–565.
[8] See: Industrial clusters: bleak times in bra town. (2016). The Economist, April 16. Also see: Lee, Y.M., Pinto, S., Simons, R., Stochniol, N., & Zverina, C. (2008). The Gujarat Diamond Cluster: Is It Forever? Harvard Business School research paper for Microeconomics of Competitiveness (May 2).
[9] Huang, Y., Shen, C., and Contractor, N.S. (2013). Distance matters: exploring proximity and homophily in virtual world networks. Decision Support Systems, 55(4), 969–977.
[10] Manyika et al. Global flows in a digital age: How trade, finance, people, and data connect the world economy. (2014). McKinsey Global Institute (April).
[11] Bughin, J. and Lund, S. The ascendency of international data flows. (2017). McKinsey Global Institute (January).
[12] Kerala: Victim of moral policing on Valentine’s Day kills himself. (2017). Indian Express (February 24).
[13] Henry, C. (2005). The clash of globalisations in the Middle East. In: Louise Fawcett (ed.), International Relations of the Middle East. Oxford: The University Press.
[14] Dobbs, R., Madgavkar, A., Manyika, J., Woetzal, J., Bughin, J., Labaye, E., & Kashyap, P. (2016). Poorer than their parents? A new perspective on income inequality. McKinsey Global Institute (July).
[15] Can Trump–or anyone–bring back American manufacturing? (2016). Knowledge at Wharton (November 30).
[16] Contractor, F.J. (2012). 7 reasons to expect US manufacturing resurgence. Yale Global (August 7).
[17] Hundreds of travel agencies in China and other emerging countries specialize in travel to the US for the express purpose of shopping. Because of intense competition and one of the world’s most open markets, prices in the US (on a wide range of items from iPhones to blue jeans to food) are among the lowest in the world. For the American consumer, this is an unmitigated boon. Of course, for the foreign visitor, the attractiveness of US prices depends on the strength or weakness of the US dollar. In 2017, the dollar is strong compared with the currencies of visitors from Latin America, and so shopping tourism has diminished somewhat from that region of the world. But the Chinese RMB (yuan), which has been appreciating against the dollar, continues to lure Chinese tourists to American shopping malls.
[18] See, for example: Mishel, L. , and Gee, K-F. (2012). Why aren’t workers benefiting from labour productivity growth in the United States? International Productivity Monitor (23, Spring), pp. 31–43. Also see: Cooper, D., and Mishel, L. (2015). The erosion of collective bargaining has widened the gap between productivity and pay. Economic Policy Institute, Washington, DC.
[19] Contractor, F.J. (2017). What is at stake in China-US relations? An estimate of jobs and money involved in the bilateral economic tie. Rutgers Business Review, Vol. 2, No. 1, pp. 1–22. Also published on this site: What’s at stake in China-US relations? An estimate of jobs and money involved in the bilateral economic tie.
[20] Autor, D.H., Dorn, D., and Hanson, G.H. (2013). The geography of trade and technology shocks in the United States. The American Economic Review, 103(3), 220–225.
[21] Hillary Clinton won the popular vote in the 2016 US presidential election, receiving 3 million more votes than Donald Trump. However, Trump won more congressional districts (many in depressed areas, or “rust belts,” in Ohio, Pennsylvania, West Virginia, etc.). Under the American electoral college system, where the number of electors only roughly corresponds with the numbers of votes cast, Trump captured the presidency.
[22] Orrenius, P. Benefits of immigration outweigh the costs. George W. Bush Institute (2; Spring). The author, Pia Orrenius, is Vice President and Senior Economist at the Dallas Federal Reserve Bank.
[23] Kirk, A. (2016). Mapped: Which country has the most immigrants? The Telegraph (21 January).
[24] Much has been made by Donald Trump about how the H-1B visa program illustrates the displacement of qualified Americans at the middle or upper end of the salary spectrum, $60–100,000 per year. The 2017 quota fixed by the US Congress was a maximum of 85,000 temporary three-year H-1B visas, a tiny fraction of the 123 million US full-time work force. True, many of these temporary workers then apply to stay in the US under permanent visas, and their applications are sponsored by their companies because of their talents. There are no reliable data on how many H-1B visas were converted to permanent visas. Even if we use the upper-end estimate that, over the years, 600,000 US permanent residents immigrated originally via the H-1B program, this number is still less than one-half of one percent of the US workforce. Moreover, H-1B visa holders are some of the planet’s most talented and skilled computer, biotech, and science-technology-engineering-math (STEM) specialists.
[25] See: Trump country: where the immigrants aren’t (2017). Populyst (February 17). Also see: 5 charts showing where France’s National Front draws its support (2017). Pew Research Center (April 21).
[26] In actuarial terms, the numbers speak for themselves. Yet, I hesitate to use these numbers as an analogy because whereas accidents are not premeditated, terrorism involves premeditated, vicious, and politically symbolic acts that deserve vigilance and countermeasures, however small the numbers of fatalities may be.
[27] Mosher, D., and Gould, S. (2017). How likely are foreign terrorists to kill Americans? The odds may surprise you. Business Insider (January 31).
[28] Motor vehicle deaths in 2016 estimated to be highest in nine years (2017). National Safety Council (February 15).
[29] After Silvio Berlusconi’s sex scandals, including with underage girls, were revealed, his ratings went up. See more here.
[30] Mitchell, A., Gottifried, J., Barthel, M., and Shearer, E. (2016). The modern news consumer—new attitudes and practices in the digital era (2016). Pew Research Center on Journalism (July 7).
[31] Ibid.
[32] Undercurrents of nationalism in China and Hindu fundamentalism in India have manifested in protests against Valentine’s Day. But they are not the dominant or driving factors affecting the attitudes of the rising consumer classes in China and India.
[33] Over the last decade, considerable cross-investment has been made by Chinese companies in Hollywood and in movie chains in the US and vice versa, as the US has invested in Chinese studios. For example, see Toonkel, J. (2017). China extends Hollywood push with $1 billion Paramount investment. Reuters Business News (January 19).
[34] Ngai, J., Sneader, K., and Zecha, C.M. (2016). China’s One Belt, One Road: Will it reshape global trade? McKinsey & Co. Podcast (July). Joe Ngai and Kevin Sneader are senior partners in McKinsey’s Hong Kong office. Cecilia Ma Zecha is the head of digital communications for Asia and is based in the Singapore office.
[35] See: Asian Infrastructure Investment Bank.
[36] French election: record far-right vote suggests populist surge isn’t over (2017). NBC News (May 8).

I have a brief ‘musing’ on the globalization conundrum at the following LinkedIn “link”: https://www.linkedin.com/pulse/what-exactly-openness-dale-mathews
LikeLiked by 1 person
nice blog post
LikeLiked by 1 person
Thank you.
LikeLike
Thank you for your comment. While your perspective is technically correct, this blog is intended for a general, educated audience, and therefore posts cannot be too bogged down in arcane details intended for a purely academic readership. More in-depth, technical analyses are reserved for Professor Contractor’s academic articles and books.
LikeLike