© 2017 Farok J. Contractor, Rutgers Business School

Recommended Citation: Contractor, Farok J. What is at stake in China-US relations? an estimate of jobs and money involved in the bilateral economic tie. Rutgers Business Review, Vol. 2, No. 1, pp. 1–22 (2017).
• This is an updated version of my January 15, 2017 post. A version of this post was published by Rutgers Business Review.
• A shorter version of this updated post was published February 28, 2017 at YaleGlobal Online as Disrupting US-China Relations Will Incur High Costs. The version below contains additional in-depth economic assumptions and calculation details that are not included in the YaleGlobal article. However, the YaleGlobal article included an addendum I wrote about the Chinese currency, posted here on March 1, 2017 as Four Salient Facts about the Chinese Yuan.
• A podcast is also available from the Yale Podcast Network.
![]()

Alarm bells are ringing about President Donald Trump’s pronouncements against China, as well as his threats to impose a 45 percent tariff against Chinese imports after declaring the country to be a “currency manipulator.”
But despite all the concern, I have not seen a single calculation of the dollar costs, or impact on jobs, if Trump’s policies were actually implemented. Thus, this post is an attempt to estimate the answers to the following questions in the event of a break in bilateral relations:
1. How many jobs in the US and China are at risk?
2. What would be the extra purchase price for American consumers if, hypothetically, imports from China were replaced by US manufactured products? Is it possible, or even likely, to “bring back” production from China to the US?
3. What would be the consequences if China retaliated against US-made products and services by pulling out its $1.2–1.8 trillion investment in US securities? And what about American companies’ investments in China?
The dearth of actual numbers is not surprising because a lot depends on what the Trump administration will, or will not, do. Moreover, economics is hardly an exact science, its calculations being very much dependent on the assumptions of its models. Nevertheless, can we at least put some numbers (for dollars, jobs, and money flows) into the different scenarios that may unfold? What is the worst that can happen? Somebody in the government should be pecking away at calculators and entering data into spreadsheets.
Here is my assessment, together with my assumptions for the calculations in each scenario. I present here only the numbers that could be at risk in the worst cases. The worst need not happen, but at least we should know the dimensions, or magnitudes, of the commercial interdependence between the two biggest economies in the world.
![]()
Jobs and Money at Stake in US-China Trade
Trump is right in highlighting the very lopsided trade imbalance between the two countries. Exhibit 1 shows a (goods plus services) deficit of $338 billion incurred “against” the US. And the president is also right in inferring that China has much more invested (i.e., to lose) in this lopsided trade (see my figures below).
![]()
Exhibit 1: The US-China Trade Imbalance

![]()
However, until 2014 the Chinese government very kindly plowed its surpluses back into US government Treasury bonds and securities—meaning that most of the money, totaling $1.2–1.8 trillion, has come right back to America’s shores (see the numbers below). It may not matter much, therefore—at least on a year-to-year basis—if the trade deficits suffered by the US against China, or the rest of the world, are compensated by foreigners pouring their trade surplus money back into US investments, as I elaborate in a later section of this post. Whether this “recycling of dollars” back to the US will continue is another open question.
![]()
Exhibit 2: Numbers of Jobs and Money in US-China Bilateral Trade, 2015

Click to enlarge table
Data Sources and Assumptions for Exhibit 2:
aImport and export numbers are from the US Census Bureau and Commerce Department.
bLabor Content Share, or Share of Export Value (LVAX), is from the World Bank’s Policy Research Working Paper 7615: The Labor Content of Exports Database, March 2016 (endnote 1).
cJiaxing and Yangon. Rising Chinese wages will only strengthen Asia’s hold on manufacturing. The Economist, March 14, 2015.
dAt $21.23 per hour for non-supervisory workers (not including benefits), according to the US Bureau of Labor Statistics (BLS), times 1,800 hours worked per year.
eAssuming an effective wage average of $34 per hour, for export-oriented manufacturing (including benefits), times 1,800 hours per year. See my earlier article: 7 Reasons to Expect US Manufacturing Resurgence. YaleGlobal, August 7, 2012 (endnote 3).
fFrom Top 20 Facts About Manufacturing (including pay and benefits). National Association of Manufacturers.
![]()
Exhibit 2 indicates the dollar numbers in US-China trade in the year 2015. Note that the US enjoys a small and growing surplus of $29.5 billion in services, offset, however, by the huge 367.1 deficit in manufactured goods.
Estimating the numbers of workers involved in US exports to China, or Chinese exports to the US, is a much more elusive and tricky task. No official direct data exist. The best guess one can hazard is by taking data from the World Bank surveys on the “labor share of export value,” or LVAX (defined as the “share of [total] labor value added embodied in gross exports…or the labor intensity of exports”).[1] “Total” means both labor content of exports (direct) plus labor content in upstream inputs (indirect). Thus, LVAX incorporates not just the labor at the final assembly point, but also at the component suppliers’ factories and their suppliers upstream—in short, labor in the entire supply chain.[2]
From the LVAX measure, we can estimate the dollar value of labor content in each country’s exports—and then estimate from those numbers the numbers of jobs or employees in each nation’s exports.
From the World Bank report (see Exhibit 3 below), I took the LVAX number for the US as .47 and for China as .26. Multiplying these by the (bilateral) exports for each country provided these estimates: that the labor content in China’s exports to the US is $129.8 billion and that the labor content in American exports to China is $75.9 billion. These estimates are shown in the “Labor Content Value” column of Exhibit 2.
The next step is to estimate from each country’s export value the number of jobs involved in each country’s bilateral exports. This requires data for average wages in the US and China. The “Average Annual Salary” column in Exhibit 2 shows the annual wages in manufacturing in China and the US. Here again a note of caution is in order, as the figures vary greatly depending on who did the survey, whether benefits and overheads are included on top of basic wages, and which region within each nation is included. For example, the $7,920 annual wage for Chinese workers (averaging $4.00–4.40 per hour) is for the eastern seaboard of China where most manufacturing takes place and assumes no additional company costs or overheads. By contrast, in the interior provinces of China, one can still hire workers for $1.00–1.50 per hour.
Similarly, as shown for the US in the “Average Annual Salary” column in Exhibit 2, the Bureau of Labor Statistics’ (BLS) $38,214 figure (not including benefits and overheads) is likely an underestimate of actual company cost, whereas the National Association of Manufacturers (NAM) figure of $81,289 is likely an overestimate. Thus, I use a middle estimate of $61,200 based on an earlier BLS figure of $34 per hour for US manufacturing workers.[3]
So how many workers in China and the US are engaged in exporting to each other’s country? By dividing the labor content value of (bilateral) exports by annual salaries, we get these estimates:
• 16.39 million Chinese workers engaged in exports to the US
• 1.24 million American workers engaged in exports to China
![]()
Exhibit 3: Total Labor Content in Exports (Direct + Indirect)
Income group is held constant for the time series and is defined according to the World Bank’s country group classification.
>
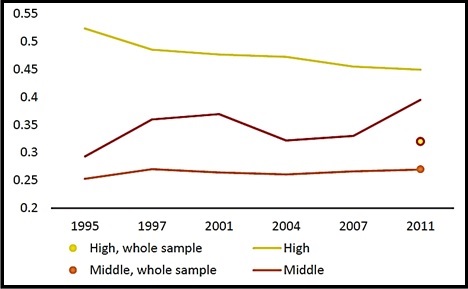
Source: World Bank [1]
Jobs and Money at Stake in Bilateral US-China Foreign Direct Investment (FDI)
Imports are not the only way a consumer gets a “foreign” product. A Chinese buying a Buick is not buying a car made in the US, but one made by General Motors’ Shanghai subsidiary (a direct investment made in China by GM in 1997). Similarly, an American purchasing a small refrigerator at Walmart is likely to buy from a Chinese company called Haier, whose US subsidiary, Haier America, Inc., produces refrigerators in South Carolina. (Of course, while assembled in South Carolina, the refrigerator has parts imported from China, just as the Buick made in China has American value components. This is one of many complications and limitations in finding and understanding FDI data.)[4]
Exhibit 4: Growth in Chinese Foreign Direct Investments (FDI) in the US
Numbers of Investments on Left; US$ Values on Right
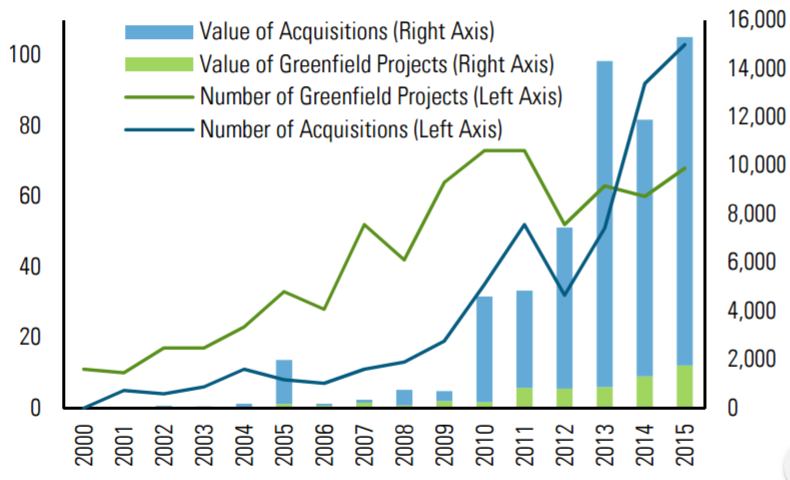
Source: Rhodium Group [5]
![]()
Chinese direct investment in the US suddenly accelerated after 2010, according to data seen in Exhibit 4 from the Rhodium Group, a consultancy and think-tank[5]. By 2015, Chinese investment in US operations had reached an annual level of $15.3 billion. Of this, $3.4 billion was invested by Chinese government state-owned enterprises (SOEs) and $11.9 billion by presumably privately held Chinese companies,[6] as seen in Exhibit 5. California is by far the favorite location, with other Chinese subsidiaries spread out over the eastern US and the “sunbelt” states.
Why do the Chinese invest in the US? Exhibit 5 provides a clear clue: the fact that the value of acquisitions of existing American firms ($13.55 billion in 2015) is almost eight times the number of greenfield (or built-from-scratch) investments ($1.76 billion) is an indication that the primary strategy is to gain technological and market knowledge from and about the US. It is not just the Chinese. FDI in the US from most emerging nations has a knowledge-seeking motivation and is acquisition-based.
![]()
Exhibit 5: In Which Sectors and US States Did Chinese Companies Invest in 2015?

Click to enlarge image
Source: Rhodium Group interactive China Investment Monitor
![]()
The Trump administration need not be greatly alarmed about this for two salient reasons: (1) The single biggest Chinese investments in 2015 were in innocuous sectors such as real estate, hospitality, and business and financial services where proprietary technology is not an issue (the largest Chinese investment to date has been in pig farming). (2) And even in sensitive sectors such as computer technology and life sciences, the White House-guided Committee on Foreign Investment in the US (CFIUS) can, and has, embargoed foreign investment in sectors deemed sensitive or where the intelligence services or Commerce Department has indicated danger to the continued competitiveness of American firms.[7]
So how many dollars are at stake in Chinese investments in the US, and US investments in China?
Exhibit 5 and Exhibit 6 show that Chinese FDI in the US in 2015 amounted to $15.3 billion. But US investment in China was almost five times as big, at $74.6 (Exhibit 6). In FDI terms, US firms have much more at stake (i.e., at risk) compared with Chinese FDI in the US.
The “Cumulative Numbers of FDI Affiliates” column in Exhibit 6 shows 6,677 American company affiliates in China in 2015, compared with around 1,200 Chinese-owned companies in the US. Their cumulative or historical dollar values in the “Cumulative $ Billions Investment” column show US FDI value in China at $228 billion compared with $90 to $100 billion or more for the value of Chinese FDI investment in the US. (This considerably underestimates the actual market value of US investment in China because of data limitations as detailed in endnote 4 and also because Chinese FDI in the US is relatively new—mainly post-2010—whereas US FDI in China goes back decades). American firms, as far as FDI is concerned, have much more to lose in the event of a commercial dispute between the two nations.
![]()
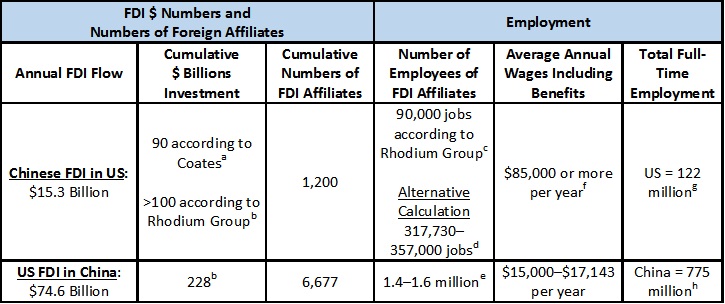
Exhibit 6: Numbers of Jobs and Money in the China-US Bilateral Direct Investment Relationship, 2015
Click to enlarge table
Data Sources and Notes for Exhibit 6:
aMike Coates. Chinese investment In the U.S. will grow In 2016. Forbes Leadership Forum, December 10, 2015.
bThe Rhodium Group counted $228 billion in 6,677 US investments into China since 1990, plus 1,200 Chinese investments into the US worth $64 billion. The figures are higher than official numbers produced in each country.
cReport by the National Committee on U.S.-China Relations and the Rhodium Group. New Neighbors: 2016 Update Chinese Investment in the United States by Congressional District. April 2016.
dEstimated as follows from Jobs Attributable to Foreign Direct Investment in the United States (numbers extrapolated from 2013 to 2015). Industry and Analysis Economics Brief, International Trade Administration, Office of Trade and Economic Analysis, US Commerce Department (Julian Richards and Elizabeth Schaefer), February 2016:
– All FDI Affiliates in US: Direct Employment 6.5 to 7 million jobs; Indirect Employment 2.4 to 3 million jobs = 8.9 to 10 million total jobs
– Cumulative FDI Stock in the US = $2,800 billion, according to sources such as Foreign Direct Investment in the United States: Update to 2013 Report. Economics & Statistics Administration, US Department of Commerce, June 20, 2016
– Chinese FDI Stock in the US (according to the Rhodium Group) = >$100 billion
– Ratio of Chinese FDI Stock/Total FDI Stock in US = $100/$2,800 = .0357
– Hence estimates for Chinese Company Employment in US: (.0357)(8.9 million) = 317,730 jobs OR (.0357)(10 million) = 357,000 jobs
eNumbers referenced by Hanemann, T., Rosen, D., & Gao, C. Two-Way Street: 25 Years of US-China Direct Investment. Report by the Rhodium Group and the National Committee on U.S.-China Relations, November 14, 2016, based on numbers from Bureau of Economic Analysis, US Commerce Department.
fTheodore H. Moran and Lindsay Oldenski report this in their book Foreign Direct Investment in the United States: Benefits, Suspicions, and Risks with Special Attention to FDI from China (Peterson Institute for International Economics, 2013). See Taylor Butch. Chinese investment translates to American jobs. International Policy Digest, September 11, 2015.
gNumber of Full-Time Employees in the United States from 1990 to 2015 (in millions). Statista.
hLabor Force in China from 2005 to 2015 (in millions). Statista.
![]()
How many jobs are at stake in Chinese investments in the US, and US investments in China? Far more jobs are at stake in China—some 1.4 million to 1.6 million. Operations in China are far more labor-intensive, and labor is cheap. But US FDI in China greatly exceeds Chinese FDI in the US.
When it comes to answering the question How many jobs are at stake in Chinese investments in the US?, the variation in estimates is distressingly high. (The reason is that statistics on FDI are themselves uncertain; see endnote 4.) According to the US Commerce Department’s Bureau of Economic Analysis, the official estimate of employment by majority-Chinese-owned businesses in the US is 37,900 direct jobs for the year 2014, which yields a total of 58,745 jobs (direct plus indirect). By “direct” I mean employees actually on the payroll of the company. By “indirect” I mean employees of firms that are suppliers to the local firm. According to the Rhodium Group, which claims to have more recent data for 2015, the 1,200 or more Chinese affiliates in the US employ directly around 90,000 Americans. (The Rhodium Group does not publicly disclose how it reaches its estimates.)
In addition, I made my own alternative estimates, including direct and indirect employment effects. These put the figure at between 317,730 and 357,000 American workers connected with Chinese FDI in the US. I derive my estimates thus: The US Commerce Department reports that between 8.9 and 10 million US residents work for foreign companies (directly and indirectly). The ratio of Chinese to “all foreign” FDI cumulative stock in the US is 0.0357, or 3.57 percent. Multiplying 0.0357 by 8.9 million to 10 million employees suggests a number between 317,730 and 357,000 jobs in the US linked to Chinese FDI subsidiaries.
The US Commerce Department’s 58,745 number is likely an underestimate. On the other hand, because of the newness of Chinese FDI in the US and other data limitations, as described in endnote 4, the 357,000 employee number is very likely an overestimate. Hence, all we can say is that the number of American jobs related to Chinese FDI in 2015 may be around 90,000 but could conceivably range up to a maximum of 357,000 jobs.
Incidentally, Moran and Oldenski, in their book Foreign Direct Investment in the United States: Benefits, Suspicions, and Risks with Special Attention to FDI from China (Peterson Institute for International Economics, 2013), report that Chinese companies in the US pay $85,000, or more, in salaries per annum, which is considerably higher than the US average. Similarly, US companies’ subsidiaries in China also pay above that country’s average. This is unsurprising because all multinational companies, in all countries, pay more than the comparative average paid by local counterparts.
The final “Total Full-Time Employment” column on the extreme right of Exhibit 6 shows total full-time employment in the US and in China to put the calculations in their larger perspective. We see that bilateral FDI employment is a small, albeit significant, percentage of overall jobs in each nation.
Putting It All Together: Maximum Number of Jobs at Stake in Bilateral US-China Trade and FDI
Adding up the numbers for exports as well as FDI between China and the US, we see in Exhibit 7 that the maximum number of jobs at risk in China is between 17.79 and 17.99 million, and in the US it is below 1.6 million.
The reader should understand that the above estimates are presented to show the “big picture,” or only the “maximum” impact on jobs in the worst-case scenarios. Short of a calamitous dispute between the countries, the worst is unlikely to happen. Later, I will conclude by outlining what is possible under this and other scenarios.
![]()
Exhibit 7: Estimates for the Maximum Numbers of Jobs Involved in the China-Us Bilateral Relationship

Click to enlarge table
![]()
Next I address related economic policy questions:
• If Chinese imports were hypothetically substituted by US manufactures, what might be the extra cost to US consumers?
• If imports from China are blocked, or subject to 45 percent tariffs, would jobs return to the US?
What are the extra costs of “…bring(ing) the jobs back from China” to US consumers?
 Blessed with abundant talent, technology, natural resources, economic flexibility, and a huge market stretching from sea to shining sea, the US is one of the few nations that could produce almost everything domestically that it now imports from China. So why doesn’t it?
Let’s compare the two alternatives:
• (A) keep importing from China
• (B) replace Chinese imports with US production
Even if (B) were cheaper—which it emphatically is not for American consumers—the transition costs from (A) to (B) for American companies (relocating factories, altering supply chains, and logistics) would be imponderably high, to the tune of hundreds of billions of dollars. In other words, this would be virtually impossible, as shown in the case of the red “Make America Great Again” Trump-supporter caps that were supposed to be all-American, even though many turned out to have foreign content. (More on this later.)
The following discussion is restricted to estimating the extra cost to consumers of replacing Chinese imports with US manufacturing.
Americans are patriotic, and many wear their patriotic zeal on their sleeves. A Boston Consulting Group report found that more than 80 percent of US respondents said they prefer items made in America—and are willing to pay more for them.[8] But when the Associated Press offered more than 1,000 survey respondents a real choice between a pair of imported jeans for $50 and a US-made pair for $85, only 30 percent answered by saying that they would buy the American-made pair.[9]
Moreover, of every dollar a consumer pays for a Chinese-made product, 55 cents is kept by US businesses for services such as marketing and sales. Less than 45 cents goes to the Chinese producer.[10] And consider the fact that only 2.7 percent of US consumer spending overall goes to products made in China, according to the Federal Reserve Bank and other studies.[11] This may sound small, but the calculation below reveals large numbers that would be a huge extra burden to each US household:
– Total consumer spending in US = $11,569 billion in 2016.[12]
– 7 percent of that (made in China) is $312.36 billion.
– Assuming 55 percent of that is US company overhead and distribution, the import value from China for consumer products is (312.36)(.45) = $140.56 billion.
– Assume hypothetically that all Chinese-made consumer products were replaced by US production, with US wages 8 times that of Chinese wages (see Exhibit 2—middle estimate for US wages in the “Average Annual Salary, Manufactures ($)” column) and labor content of approximately 30 percent (see “Labor Content of Exports” from the World Bank[1]).
– Hence, labor content of $140.56 billion in imports = (.30)(140.56) = $42.17 billion in Chinese wages.
– Equivalent US wages = (42.17)(8) = $337.34 billion.
– Hence, the additional cost to US Consumers = 337.34 – 42.17 = $295.17 billion in 2016 (or $295,170 million).
– Number of households in US = approximately 124 million.[13]
– Hence, the annual additional cost per household per year = 295,170/124 = $2,380 for consumer purchases.
Are US consumers able, or willing, to bear $295 billion in additional costs, or an extra $2,380 per household, per year? In a warlike emergency, the answer may perhaps be a “yes.” But otherwise, the Associated Press survey suggests that ordinarily only 30 percent of Americans are willing to pay more. Furthermore, the above estimate is only for consumer products and does not include US imports of industrial output from China.
Policy shifts also have unforeseen consequences and knock-on effects, such as inflation—which has been quiescent for the past decade, but could be reignited by an additional burden of $295 billion.
Is it even possible to “…bring (all) the jobs back from China”?
In theory, yes—but at a huge cost to US companies. As a practical matter, each manufacturer is so linked or embedded in a large supply chain network (for components and parts) that it is not simply a matter of moving a factory from one country to another. Suppliers and their subcontractors need to move as well, which is always difficult and sometimes impossible.
Consider the two cautionary tales below.
General Electric’s Attempt to “Re-Shore” Jobs
Through 2015, General Electric’s appliance division tried to “re-shore” manufacturing back to the US. Assembly operations were returned to the home country on the assumption that even though American workers would be far more expensive, automation would require far fewer of them than in China. With wages and the renminbi (RMB, or yuan—the Chinese currency) rising in China, it was assumed that the overall labor cost in the US would soon be only a little more than in China. (My earlier article in YaleGlobal shows that re-shoring is feasible for some companies because US workers are so much more productive than any other workers in the world.[3])
Whatever GE’s labor costs turned out to be was not the problem. The far bigger impediment was that the parts-supply base for appliance components had disappeared from the US. Chinese parts suppliers are efficient and sell at reasonably low prices. Adding the transport costs of parts shipped from China to the US assembly lines, plus management and additional inventory costs for GE Appliances, made producing appliances in the US more costly overall—despite assembly labor in the US being competitive.
Finally, in June 2016 GE gave up the whole idea and sold their entire appliances division to the Chinese company Haier for $5.4 billion.
Were Trump Campaign’s Hats “Made in USA”?
 As a presidential candidate espousing nativist and protectionist views, Trump was especially careful to ensure his campaign’s red “Make America Great Again” caps were entirely US-made. Microscopic analysis sponsored by the Associated Press and attested by apparel industry experts revealed, however, that a portion of Trump’s caps “are made in the USA, but all the materials are not.”[14]
One really should not blame Trump or his staff severely for this boo-boo because the supply chain in fabric and apparel is devilishly complicated and internationally dispersed. The US produces cotton, much of which is exported and blended with other fibers in third countries such as Guatemala or China. From that, yarn may be sourced from more countries and weaving done in another, and large fabric warehouses routinely mix and match cloth with little heed to the material’s origin.
The US worker remains by far the most productive in the world. Until 2010, the US was the world’s largest manufacturer (see Exhibit 8), and US manufacturing has indeed grown back by 27 percent since 2009. But few of the jobs in China are likely to return for two reasons:
- If tariffs were levied only against China, jobs would move from there to other low-wage nations such as Vietnam or Bangladesh.
2. Bringing all the elements of an entire supply chain “back” to the US is only a theoretical dream.
![]()
Exhibit 8: The US Is Still a Leading Competitive Manufacturer
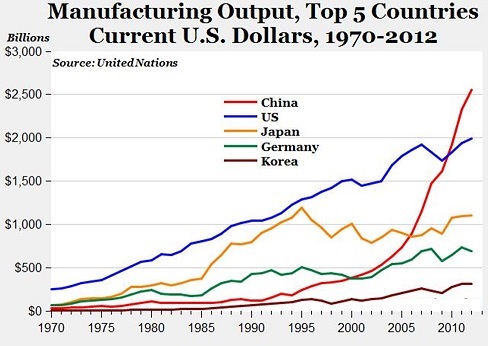
Source: Mark Perry, American Enterprise Institute [15]
Click to enlarge table
![]()
Are China’s $1.8 to 2 trillion security holdings in the US a cause for concern?
Some observers have expressed alarm that the Chinese government holds $1.3 trillion in US Treasury bonds and that Chinese entities collectively own $2 trillion, or thereabouts, in US securities. (This is not counting the ownership of more than 1,200 US-based companies through FDI [see Exhibit 6] or real estate.)
Exhibit 9 shows the principal foreign holders of US securities as of June 30, 2015. The Chinese Mainland government (People’s Bank of China, or PBoC) held $1.3 trillion in long-term Treasury bonds in June 2015. (An intriguing side observation is that this holding had been reduced, by October 2016, to $1.12 trillion by the PBoC’s selling dollars in foreign exchange markets in order to prop up, or increase, the value of the yuan or RMB—a behavior counter to what Trump has been alleging.)[16]
In addition to Treasury bonds, the PBoC holds Asset-Backed Securities (ABS) and equities, for a total of $1.84 trillion as of June 2015. Moreover, some hold opinions that the Chinese total may be even higher, if one adds US Security holdings by Hong Kong-based owners and from tax havens such as the Cayman Islands, Bermuda, and the British Virgin Islands, where the identity of the beneficial owner is often murky.
![]()
Exhibit 9: Foreign Holdings of US Securities, 2015

Click to enlarge table
*ABS = Asset-backed securities, such as credit card receivables, auto loans, manufactured-housing contracts, and home-equity loans.
The People’s Bank of China (PBoC) held $1.3 trillion in long-term Treasury bonds as of June 30, 2015.
Source: US Treasury Department [17]
![]()
Dire Scenario
So what is the nature of the concern? The fears some voice are that, in an emergency or a warlike situation, the Chinese may take the following two steps, resulting in a dire scenario:
• In Step 1, the Chinese would “dump” or precipitously sell their US security holdings, causing panic in the US bond and equity markets.
• Then in the even gloomier Step 2, having sold their securities for dollar cash, a massive sell-off of dollar cash in the foreign exchange markets would ensue, creating a plunge in the value of the dollar in world foreign exchange markets.
While within the realm of remote possibility, this scenario is very unlikely to happen, short of a military confrontation. For the past 25 years, the Chinese government has looked on the US as its principal foreign market, with up to 18 million of its workers directly or indirectly involved with US trade and FDI (see Exhibit 7). And they have every incentive to keep the US consumer happy and the US economy going strong: simply put, it is a matter of self-interest.
Why are Chinese security holdings so high?
And, after all, how is it that Chinese holdings of US securities have grown as high as $2 trillion? Consider what happens when a Chinese exporter is paid in dollars.[18] Chinese exporters are required to hand over their dollar earnings to their bank (for RMB at whatever prevailing exchange rate), and the bank in turn hands the dollars over to the Chinese central bank, the PBoC. The PBoC uses some of the earned dollars, in a reverse flow through the banks, to finance imports coming into China, which are also paid for in dollars. But recall that China runs a huge surplus in trade, not just against the US ($338 billion for 2015, as shown in Exhibit 1), but also against the world as a whole. This means that, every year, especially since joining the World Trade Organization (WTO) in 2001, China has been taking in billions of dollars more than it has spent (on imports or other external projects).
What to do with the accumulating surplus dollars? Holding trillions of dollars as cash makes little sense. What better place to park the dollars than in US Treasury bonds, equities, and ABS (see Exhibit 9)?
There is a self-interested angle to this: US customers and the US economy are the largest single buying group for the Chinese, who want to keep them happy and willing to spend. The $2 trillion in investments in US securities do not earn a high return, but the investment is safe and helps to
• Keep US Treasury bond interest rates low (which has a ripple effect throughout the US economy in marginally lowering interest rates);
• Finance the US government budget deficit. (The US government spends more each year than it collects in tax revenue by selling US Treasury bonds to anyone willing to buy them, whether the buyers are Americans, Chinese, Brits, or Japanese. See Exhibit 9.); and
• Keep car loans, home equity, and credit card rates somewhat lower than they would be otherwise.
And to a slight extent, Chinese buying supports US equities.
The large holdings are, in effect, an expression by the Chinese government of support for, and faith in, US-China trade and the global trading system. If it were to sell these holdings, and precipitate a crisis with sharply escalated US interest rates, this would be self-defeating for the Chinese economy—and for up to 18 million Chinese workers who depend on US demand.
China’s Economic Transition and New Areas of Competitiveness
With a flattening labor force, rising wages and living standard expectations, and an increasingly well-educated population, China no longer feels it has a large competitive advantage in being the “factory of the world” for low-margin products such as toasters and appliances—or in low-skill assembly work. It is effecting a transition away from mass, repetitive manufacturing, where other nations such as Vietnam and India can compete and where the value contribution is low, to more profitable ends of the value chain, such as R&D and brand equity, as seen in Exhibit 10.
According to UNESCO, from 1996 to 2013, China increased its share of global R&D from 2.5 percent to 19.6 percent. By comparison, the US accounts for around 30 percent.[19] Leading in R&D expenditures are computer technology giants such as Huawei Technologies Co., Ltd. and ZTE, former contract manufacturers that now have developed a strong internal research capability to rival that of their former contractors. Huawei alone has 16 R&D centers around the globe, including Europe and the US. China is one of the leading innovators in solar technology, in electronic storage, in a few biotechnology fields, and in developing robotics capability—anticipating the days when Chinese wages rise even further to the point where robots economically replace persons.
![]()
Exhibit 10: Moving to More Profitable Portions of the Value Chain

Click to enlarge graph
Haier, having purchased GE’s appliance division for $5 billion, is moving in the other direction, as shown in Exhibit 10—toward building brand value and after-sales services in the US and European markets.
Both Huawei and Haier illustrate the areas of future competition with US firms—not necessarily in manufacturing, but in innovation, design, research, and global brand equity—the more profitable elements of the value chain.
Conclusion: The Quarreling Couple That Needs to Keep Dancing Together
The Chinese are not thrilled about their entanglement with the US economy any more than President Trump is. But like a quarreling couple, the two nations have kept dancing together out of mutual self-interest. The US-China relationship is the most important in the world. Together, the two nations account for 40 percent of world GDP and 23 percent of the world’s population.
Since the death of Mao Zedong in 1976 and the emergence of China on the world commercial stage, both countries have benefited enormously from each other. Participation in global trade has created employment for over 100 million Chinese (16 million Chinese for the US market alone by my calculation in Exhibit 2), raising them from rural poverty to lower-middle-class status. Using the World Bank’s criterion for grinding poverty as $1.90 per person per day, poverty in China was reduced from nearly 90 percent in 1982 to only 7 percent in 2015.[20] This is an astonishing accomplishment, unprecedented in world history for pulling almost a billion persons out of abject poverty in one generation. Besides which, the same economic forces have propelled additional hundreds of millions of Chinese out of lower-middle-class status and into affluence.
US trade does not entirely explain the poverty reduction. After all, China trades with other countries and has had a growing domestic market with increasing spending power and affluence. But China’s exports to the US market have certainly played an important part.
The US has also gained from the relationship:
• 1.3 to 1.6 million American jobs that depend on China (see estimates in Exhibit 7);
• $295 billion annually in lower prices ($2,380 lower costs per each US household per year) for purchased products; and
• Chinese reinvestment in US securities, helping to finance the US government budget and marginally keeping US interest rates lower.
President Trump is right, however, in asserting that China has benefited more from the relationship than has the US. But International Trade Theory (and practice) never suggested that the benefits of trade would be equally shared. All it says is that both trading nations will be better off participating in international trade compared with not participating.
Candidate Trump alleged that the loss of US jobs is “…the greatest theft in the history of the world.” This assertion is mostly false, accurate only in very small part because
• For every one US job lost through international trade (1980–2016), informed analysts, such as the Wharton School,[21] conclude that three or four jobs have been lost because of automation, robotics, information technology, and other productivity[22]
• If China did not exist on the planet, other low-wage nations would fill its place, such as Vietnam, India, or Bangladesh. Hundreds of millions of poor people are willing to work for less than $1 per hour.
• Hence the Trumpian proposal to bring jobs “back to the US” is economically non-viable. Hundreds, perhaps thousands, of Chinese factories facing rising wages and a shortage of skilled workers (following China’s one-child population policy) have already taken the initiative to shut down operations in China and have relocated to Vietnam, Bangladesh, or other nations. (Even if the US imports from Bangladesh or Vietnam, it may still be buying from a Chinese-owned firm).
• Should a Trump administration actually carry out its threats to levy a 45 percent tariff on Chinese products, production is unlikely to return to the US to any significant degree. Other nations, such as India, Lesotho, and Bangladesh, where the poor are willing to toil on behalf of US consumers for a pittance, will fill the breach. However, the resulting disruption of global value chains would add costs to the tune of hundreds of billions per year and increase prices for US buyers by hundreds of dollars per capita. The extra cost of tariffs on Chinese imports would fall disproportionately on lower-income Americans for two reasons: (a) these Americans are more likely to buy China-made products because of price sensitivity, and (b) the extra tariff cost is a larger fraction of their personal income compared with that of more affluent Americans.
The two great nations—one having become known as the biggest economy on earth and champion of democracy, the other having awoken from centuries of self-imposed commercial isolation after the death of Emperor Zhu Di to regain its place on the world stage—need each other.
Is the relationship going to be “bipolar” and fraught with anxiety and tension? Or will China and the US continue their historic cooperation and be the two “poles,” or pillars, of the 21st-century global economy?
![]()

Thanks so much, Farok. I truly enjoyed reading this.
LikeLike