© 2018, Farok J. Contractor, Rutgers Business School
Note: See the Updated Post of May 5, 2025:
Misrepresentations About International Trade:
The Case of Apple’s iPhone
Trade Statistics Alone Can Frighten and Mislead
In my July 11, 2018 blog post, The US-China Trade Spat: How the Public, Media, and Politicians Can Be Deceived by Data, I described how taking data and statistics out of the context of the larger picture can be not only frightening, but misleading.
To see how deceptive it is to look at trade data alone, take the iPhone7 as an example. Most iPhone components are sourced by Apple Inc. from other countries. Components from South Korea, Japan, Germany, China, and some from the US flow from these sources to be assembled by a Chinese firm called Foxconn. But most of this component trade flow is not counted in the bilateral US-China trade statistics. All that is counted in the US-China trade data are (a) the $258 invoiced amount of the finished or assembled iPhone7 (shipped by Foxconn from China to the US) and (b) $75 worth of US-made components (shipped from the US to China for assembly there).
Trade Data Paint a Lopsided Picture
Once assembled, the finished iPhone7 is sold, or exported, to Apple for an estimated export invoice value of $258. Here’s what the trade data look like:

Click table to enlarge
Sources: Kif Leswing, The parts in an iPhone 7 only cost $219, according to a new estimate, Business Insider, September 20, 2016; Adam Jourdan, Designed in California, made in China: how the iPhone skews U.S. trade deficit, Reuters, March 21, 2018.
Caveats: Like most firms, Apple Inc. maintains confidentiality about its procurement countries and costs. Hence the above numbers are the best estimates made by journalists and others in the industry. Some of the estimates diverge, but the general conclusions of this blog piece remain valid.
A Production Value-Added Comparison Shows a Very Different Picture
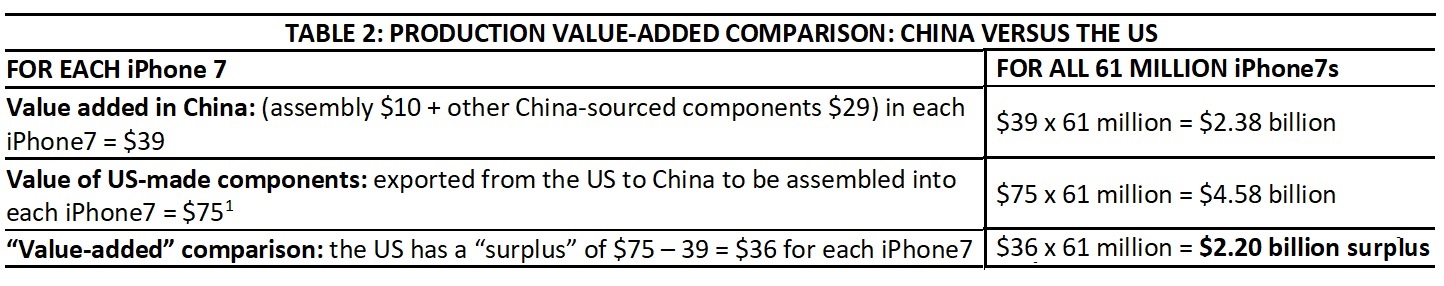
The iPhone7—just one product—is therefore supposed to create a frightening trade deficit of $11.16 billion. But this is highly deceptive! Apple pays Foxconn only around $10 for the assembly work. That $10, plus some other minor components sourced from China, makes the value added in China only around $39. ($219 represents components from other nations imported by China and then assembled into the iPhone 7.) Nevertheless, when the iPhone is assembled and shipped to the US, its approximate $258 invoice value is counted in the trade data as the value of the “iPhone imported from China.”
Click table to enlarge
By comparing the bottom-line numbers in TABLE 1: TRADE STATISTICS COMPARISON with TABLE 2: PRODUCTION VALUE-ADDED COMPARISON, we can see how misleading it can be to look only at trade data. These data seem to show that the iPhone7 alone causes an $11.16 billion trade deficit, whereas the value-added comparison shows a surplus for the US of $2.20 billion.
Figure 1
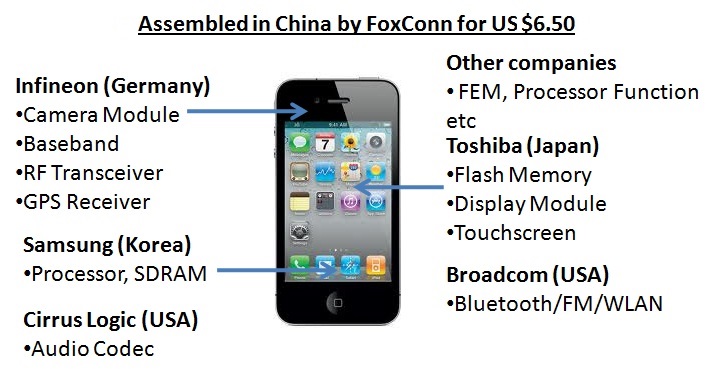
This figure does not necessarily represent the iPhone 7 and is used for illustration purposes only. Click image to enlarge.
Should We Count the Value of Apple’s Research, Designs, and Marketing?
Table 2 shows only the “Production Value Added” comparison between China and the US. The picture is actually even more complicated. Trade and production value-added data do not include a multinational company’s centralized research and development (R&D) expenditures or marketing overheads. Apple’s R&D and marketing campaigns are done in the US by a huge staff of scientists, IT experts, and marketers at its Cupertino, California headquarters. The $258 invoiced amount for the iPhone7 assembled in China and exported to Apple USA does not include Apple’s R&D and marketing—these are not counted in trade statistics. But if we include Apple’s R&D and other overheads, then the overwhelming bulk of the value would appear to be added in the US. Retail price ($649) minus ($258 China invoiced export value[2]) plus ($75 components exported from the US to China) = $466 value added in the US.
Figure 2
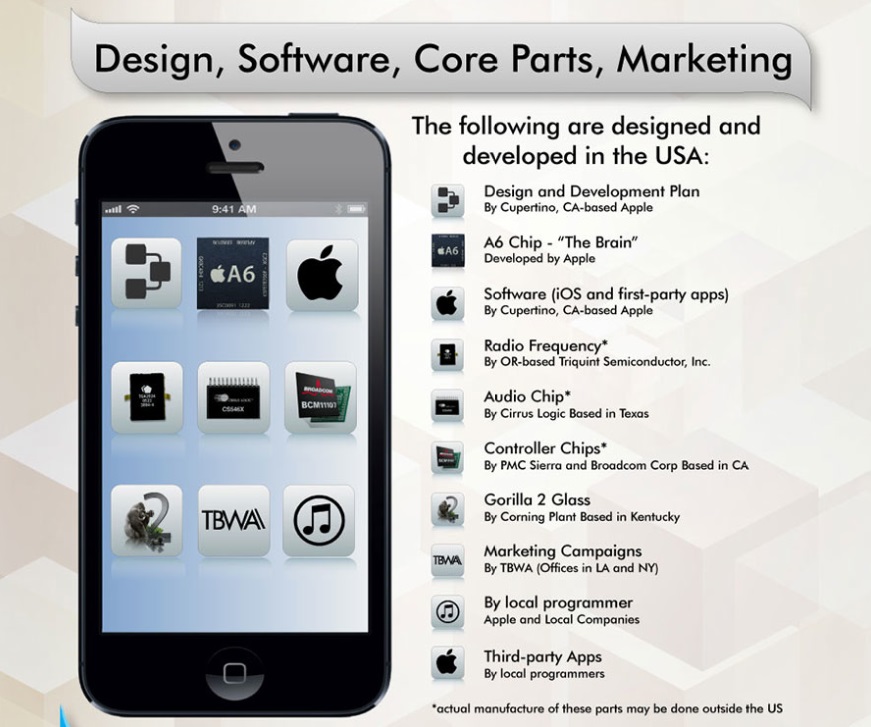
This figure does not necessarily represent the iPhone 7 and is used for illustration purposes only. Click image to enlarge.
What a Service Economy Looks Like
After all, being a “service economy” driven by creativity and innovation, the real strength of US companies is in their R&D, which is a long-term job creator. What is the real value Apple Inc. contributes? The company hardly makes anything itself. Instead, Apple is correctly identified as a world-beating R&D organization, a creator of high-tech designs, and an orchestrator of global supply chains in which components from a dozen or more nations flow to China to be assembled there, and the finished products are then exported from China to the rest of the world’s markets—all under the supervision and control of Apple.
Roughly speaking, the $649 retail value of the iPhone7 minus the $258 assembled production cost, or $649 – 258 = $391, may be described as Apple’s “gross margin.” The gross margin includes dividends distributed to shareholders. But much of the rest of the “margin” may be described simply as returns on “thought”—the ideas and creativity of the scientists, engineers, marketers, and distributors of iPhones.
Similarly, even for each component, we could break down its value between the raw materials that went into making the component versus the thought and service overheads that went into designing that component. The mere “raw material” component of an iPhone may add up to less than $5 (even including some “rare earth” elements). The rest of the value is simply in thought.
Such is the high-tech, service economy we live in today. The iPhone may be an extreme example. But for the US-China trade as a whole, analysts estimate that the trade deficit “suffered” by the US would shrink by at least 36 percent on a production value-added comparison.[3] And the perceived role of American companies’ value added would increase far more, if we also included their R&D, branding and marketing, and services contributions (which do not necessarily enter into the trade or production data).
Related:
- For a detailed discussion of how deceptive it is to look at data and statistics alone without seeing the larger picture, see my July 11, 2018 blog post, The US-China Trade Spat: How the Public, Media, and Politicians Can Be Deceived by Data.
- Xinhua, China’s leading official news agency, conducted a 30-minute interview with me on June 18, 2018—see my July 10, 2018 blog post, The US-China Trade Spat: My Interview with Xinhua – June 18, 2018.
References
[1] This is the most problematic estimate. Apple Inc. will not disclose the information. Journalists like Kif Leswing (see Table 1 sources) publish a breakdown of parts probably made in the US. However, even that is uncertain since the US component manufacturer will have sourced some subcomponents from other countries. Because of the confidentiality of Apple’s costing, different analysts’ numbers vary somewhat. However, the broad conclusions of this piece remain valid.
[2] The subtracted amount of $258 includes the $75 worth of components sourced from the US, which is why the $75 is added back into the calculation for the overall US value added.
[3] Louis Kuijs, Research Briefing | China: Impact of US trade action on China to be manageable, Oxford Economics, March 20, 2018. Also see Roger Fingas, Apple’s iPhone may be creating misleading numbers for US trade deficit with China, AppleInsider.com, March 21, 2018.
