
© 2018, Farok J. Contractor, Rutgers Business School
Trade Statistics Can Be Less Than Half the China Story
Looking at trade statistics alone is misleading because they lack overall context. The $337 billion US deficit with China in 2017 sounds scary. But a review of other economic factors provides insight into the larger picture.
1. The Bigger Picture
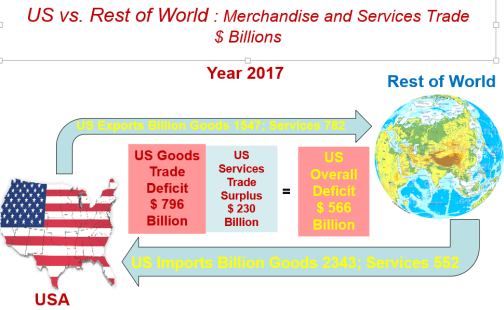
To see the big picture, from a balance-of-payments perspective, most of the 2017 $337 billion “deficit” will come back to the US anyway (see Figure 1). China spent some of those dollars on imports from other countries, which in turn spent those dollars on US products. In time, China will return the rest of the $337 billion directly to the US since the Chinese government invests its surplus dollars in US Treasury Bonds and other US assets. China (including Hong Kong) holds $1.4 trillion in US Treasury securities. (See my April 13, 2018 blog post, Ten Quick Facts About US Trade: Deficits, Dumping, and Discords.)
Figure 1

2. The US Has a Trade Deficit with 102 Other Nations
And the deficit isn’t just with China. The US runs a trade deficit with the rest of the world, although imports from China is the biggest component (see Figure 2). Again, this is not scary—as long as the surplus dollars eventually return to the US.
Figure 2
Foreign countries that have a trade surplus with the US accumulate dollars each year. Those dollars are eventually recirculated back into American assets, such as:
- Equity investments, US Treasury securities, and other assets totaling $18,436 billion held by foreigners in June 2017[1]
- US-located companies owned by foreigners whose foreign direct investment (FDI) stock was around $6,000 billion in 2017[2]
- US real estate estimated to be around $3,000 billion held by foreigners[3]
3. US Manufacturing and Consumerism
Nor does the deficit mean that anything is wrong with the competitiveness of US manufacturing—it remains the most productive in the world. The main explanation for US trade deficits against the rest of the world (something that has been going on for 35 years) is that Americans, who have one of the highest spending powers in the world, save very little and buy a lot, keeping US imports high. We binge on appliances, garments, toys, and other goods made by millions of workers around the world earning only $2–5 per hour.
FDI by Multinational Companies Can Be as Important as Trade
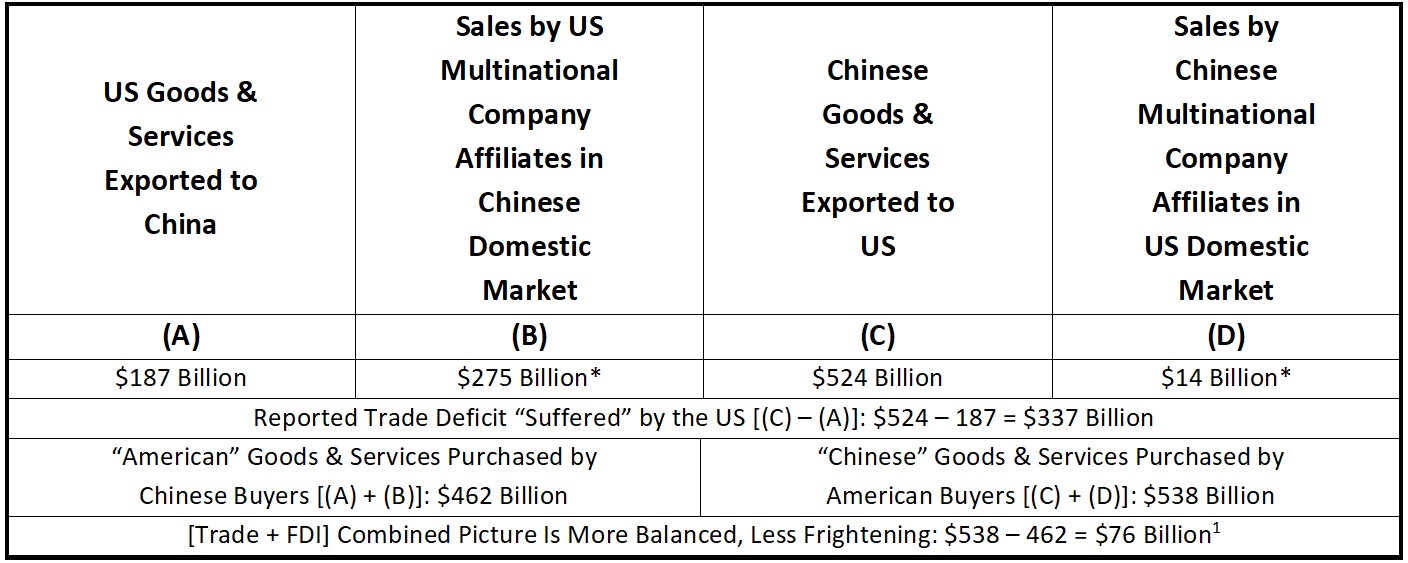
In Table 1, categories (A) and (C) are only the trade numbers. Looking only at [(C) – (A)] = 524 – 187 = $337 billion gives us the seemingly frightening trade deficit the US “suffers” against China. But that’s looking at only half the picture—something that can fool the public, the media, and politicians. The other side of the coin is the amount sold by US company affiliates in China (B) and what Chinese company affiliates sell in the US domestic market (D).
Table 1
Click to enlarge
*Caveats: While the trade statistics (A) and (C) are firm and known, the numbers in categories (B) and (D) are only estimates. First of all, the data for sales by multinational company affiliates in a foreign country are not as good to start with. More importantly, the portion of the sales recorded by a multinational company’s affiliates in a foreign country sold domestically versus exported is a soft estimate. For example, it is reported that 43 percent of China’s exports are organized by multinational companies. Hence, only a fraction of the sales made in China by US company affiliates over there are likely to have been sold in China domestically, the rest exported out of China by the US company affiliate.
The consumer perspective is more balanced: Chinese consumers buying so-called “American” goods and services [(A) + (B)] = 187 + 275 = $462 billion, and American consumers buying so-called “Chinese” goods and services [(C) + (D)] = 524 + 14 = $538 billion. The consumer perspective [Imports combined with purchases from foreign companies’ local production] shows a more balanced picture[4]—$462 billion compared with $538 billion—even though trade numbers, seeming more out of balance, may frighten some government officials in the US.
Toyota and Honda’s FDI subsidiaries in the US assemble cars in the US, and they also import vehicles from Japan and Mexico. The consumer is not concerned about the distinction, and will happily buy a Toyota regardless of whether it was imported or locally made. In their minds, American car buyers label Toyota and Honda as “Japanese” companies. Yet, analyses by Cars.com and Motor Trend Magazine in 2017 concluded that, in terms of domestic value, or US content, the Toyota Camry was the most “American” vehicle, followed by the No. 2 ranked Toyota Siena. Ranked No. 4 was the Honda Odyssey. Three of the top five were “Japanese”-label vehicles even though they were assembled in the US and had the highest domestic US parts content.[5]
Similarly, Chinese who buy so-called American products and services do not care much as whether the items were (A) imported from the US: 187 billion, or (B) were made in China by American companies: 275 billion. To them, both are “American.” The important fact, however, is that [(A) + (B)] = 187 + 275 = $462 billion, is a figure much more in balance with (C) + (D) than merely looking at the trade statistics would suggest.
On a Value-Added Comparison, the Trade Deficit Would Shrink by More Than One-Third
There is yet another angle or perspective: How much value is added in the country in which the product is sold?
Take, for example, the iPhone7, most of whose components are sourced by Apple, Inc. from other countries. Components from South Korea, Japan, Germany, China, and the US flow from these nations into China to be assembled there by a company called Foxconn—but most of this component trade flow is not counted in the bilateral US-China trade statistics. All that is counted in the US-China trade data are (a) the $258 invoiced amount of the assembled iPhone7 (assembled and shipped from China to the US) and (b) $75 worth of US-made components (shipped from the US to China for assembly there). This creates a seemingly horrendous trade deficit: ($258 – 75) x (61 million iPhone7s) = $11.16 billion trade deficit “suffered” by the US on just one product—the iPhone7. (For a detailed calculation, see my July 12, 2018 blog post, Does Just One Product–the iPhone–Cause an $11 Billion Trade Deficit for the US?)
But looking at trade data alone is highly misleading! A more appropriate comparison would be to compare the value added in China ($39—the Chinese assembly cost of $10 plus some Chinese components worth $29) versus the value added in the US ($75 worth of components made in the US). This leads to a very different picture of a “surplus” for the US of ($75 – 39) x (61 million iPhone7s) = $2.20 billion surplus in favor of the US.
Surplus? Deficit? Conclusion: A value-added comparison is more realistic, and is more correlated with jobs, than the trade statistics. The iPhone may be an extreme example, but for the US-China trade as a whole, analysts estimate that the trade deficit “suffered” by the US would shrink by at least 36 percent in a value-added comparison.[6]
 Chinese Perspectives
1. The Chinese Say “Your Own Companies Are Partially Responsible” for the Trade Deficit
As much as 43 percent of China’s merchandise exports in 2017 were set up and coordinated by foreign multinational companies (such as Apple, Dell, or the tens of thousands of US, European, and Japanese firms that commissioned imports from Chinese companies. In effect, the Chinese say, “Do not blame us for something that your companies set up to take advantage of low-cost labor in China.”
2. Is It Right to Use the Word “Suffer,” as in “The US Suffered a $337 Billion Trade Deficit with China”?
True, many jobs have gone away from the US. Yet the dynamic and innovative American economy keeps creating new jobs. Currently, the US has full employment. At the same time, when an American consumer buys a reasonably well-made shirt imported from China, or a laptop assembled there, for far less than what it would cost otherwise, there is an enormous benefit to 330 million US consumers.
In my March 10, 2017 blog post, What’s at Stake in China-US Relations? An Estimate of Jobs and Money Involved in the Bilateral Economic Tie, I calculated that if imports from China were replaced with US production there would be $295 billion in additional costs, or an extra $2,380 per household per year. This extra cost or expenditure would hit poor families in the US even harder because lower-income Americans who shop at Walmart or Kohls depend even more on lower cost purchases (while the wealthy can afford $250 US-made jeans or the $600 Hermes scarf made in France). According to some estimates, an “all-American content” iPhone would cost the US consumer $2,000 or more.[7] Chinese imports have been a huge benefit to American households, and not a “suffering.”
3. China May Not Be Pushed Around So Easily as Before and Can Retaliate Against US Firms in China
China’s own internal market and economy has grown big, so it is less dependent on the US or the rest of the world. In 2007, China’s exports-to-GDP ratio was 37 percent. Today it is below 19 percent.
Secondly, while China imports only $187 billion from the US [(A) in Table 1], US companies produce and sell in China a larger amount, $275 billion [(B) in Table 1]. If the Chinese really wished to retaliate, they could organize a boycott of American goods and services, which could really hurt. In 2012, when China and Japan had a disagreement about some islands in their neighborhood, the Chinese boycott of Japanese products hurt companies like Toyota very badly, and Toyota sales have not yet fully recovered.[8]
Conclusion—Sobering Questions for Americans
Are Americans willing to shell out $2,380 more per year for purchases? What about the soybean, corn, chicken, and pork farmers who may not be able to sell to China anymore? What will happen to workers in Harley Davidson factories laid off in Pennsylvania, Wisconsin, and Missouri because retaliatory tariffs, levied by the Europeans against the import of American-made motorcycles, are pricing Harleys out of the European market? Are you willing to pay over $2,000 for an iPhone?
Related:
- Xinhua, China’s leading official news agency, conducted a 30-minute interview with me on June 18, 2018—see my July 10, 2018 blog post, The US-China Trade Spat: My Interview with Xinhua – June 18, 2018.
- For a detailed calculation of how the iPhone results in a US trade deficit, see my July 12, 2018 blog post, Does Just One Product–the iPhone–Cause an $11 Billion Trade Deficit for the US?
References
[1] From U.S. Department of the Treasury, Preliminary Report On Foreign Holdings Of U.S. Securities At End-June 2017, February 18, 2018.
[2] FDI stock in the US is around $6 trillion, according to the United States Department of Commerce, Economics & Statistics Administration, Foreign Direct Investment in the United States, October 3, 2017.
[3] This is an educated guess since no records exist before 2009, and even thereafter records are spotty. See CNN Money, Foreigners are getting serious about “Buying American” real estate, July 18, 2017.
[4] See The Economist, America Inc and the rage against Beijing: Boohoo. Just how badly has US business been treated by China? June 28, 2018.
[5] See Forbes, The Most American Made Cars and Trucks. (Accessed July 8, 2018)
[6] Louis Kuijs, Research Briefing | China: Impact of US trade action on China to be manageable, Oxford Economics, March 20, 2018. Also see Roger Fingas, Apple’s iPhone may be creating misleading numbers for US trade deficit with China, AppleInsider.com, March 21, 2018.
[7] Stacey Vanek Smith, How much would an all-American iPhone cost? Marketplace, May 20, 2014.
[8] Bloomberg, Chinese Boycott May Be More Costly For Japan Than The Tsunami, September 19, 2012.
